Identifying On-Neck patterns does not guarantee profitable continuation trades. Pattern recognition failures can lead to entries at reversal points that result in immediate losses. Thomas Bulkowski’s tests put the pattern at a bearish continuation 56% of the time, which he calls near random, so confirmation is not optional. Leverage amplifies both gains and losses on every trade. Past performance is not indicative of future results. Capital at risk.
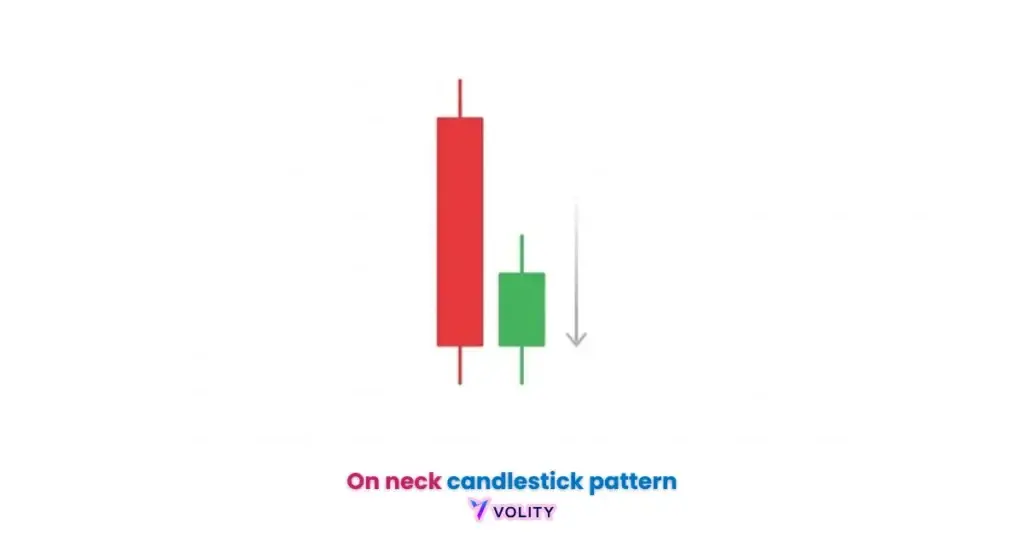
The On-Neck is a two-candle bearish continuation pattern that prints during a downtrend. It consists of a long bearish candle followed by a smaller bullish candle that closes at or near the prior low. This formation signals that the temporary bullish push has failed to reclaim the neckline, indicating that the prevailing downward momentum is likely to resume after a brief pause.
The On-Neck pattern functions as a critical visual indicator for identifying trend persistence in volatile candlestick patterns analysis. This formation identifies the specific moment where bullish momentum is absorbed by prevailing institutional selling pressure. It serves as a secondary entry signal for traders who missed the initial trend breakout.
The 2026 trading landscape utilizes automated pattern recognition to filter these signals based on volume profile and structural location. Mastering the technical distinction between “On-Neck” and its variations allows investors to avoid false reversal traps during corrective price action.
While understanding On Neck Candlestick Pattern is important, applying that knowledge is where the real growth happens. Create Your Free Forex Trading Account to practice with a free demo account and put your strategy to the test.
What is an On-Neck candlestick pattern?
The On-Neck is a two-candle bearish continuation pattern that appears during an existing downtrend and signals that selling pressure is likely to resume. This formation represents a failed attempt by bulls to reclaim higher prices. The pattern emerges when buyers exhaust their strength within the downtrend channel.
Three core mechanics define On-Neck structure:
- Technical Definition: Long bearish bar followed by a small bullish bar closing at the prior low. The size differential matters, the second candle must be significantly smaller than the first.
- The “Neckline” Concept: The temporary support level that buyers fail to break. This horizontal resistance defines the exact closure requirement.
- Bearish vs. Bullish: Why the small green candle is a “trap” for inexperienced traders. Beginners often misinterpret the green candle as bullish reversal potential.
The BIS publishes no study linking candlestick reliability to turnover, and no publication of that name exists. What the BIS does publish is the April 2025 OTC foreign exchange turnover survey, which puts global daily turnover at 9.6 trillion US dollars. Deep liquidity means a pattern is less likely to be an artefact of a thin book, which is a reason to prefer major pairs, not evidence that the pattern works.
The Failure of Bullish Momentum
A failed reversal is a market condition where a corrective bullish move lacks the volume required to overcome established resistance levels. This failure creates a high-probability continuation opportunity. The second candle represents the institutional rejection of higher prices.
Exhaustion of buyer interest occurs when price reaches the neckline but cannot sustain strength. Re-entry of institutional short sellers at the “neckline” confirms the pattern and accelerates the continuation move downward.
Ready to Elevate Your Trading?
You have the information. Now, get the platform. Join thousands of successful traders who use Volity for its powerful tools, fast execution, and dedicated support.
Create Your Account in Under 3 MinutesHow to identify the On-Neck pattern: Anatomy and Rules
Accurate On-Neck identification requires a long bearish candle and a subsequent bullish candle that closes precisely at the previous low. Mastering how to read candlesticks is essential for verifying these exact closure rules. The closure rule prevents false signal generation.
Three visual requirements define valid On-Neck patterns:
- Candle 1: A “tall” bearish body that confirms the dominant downward trend. This large red candle establishes the momentum foundation.
- Candle 2: A small bullish body that opens with a gap down but recovers slightly. The recovery shows buyer effort but insufficient strength.
- The “Close Rule”: The second candle MUST close at or extremely close to the low of Candle 1. This mechanical exactness matters for reliability. Unlike a single candlestick pattern which may be a simple spike, the On-Neck provides structural continuation.
There is no standard numeric tolerance for the “Close Rule” and no charting platform publishes one. The workable test is the one Bulkowski uses: the second candle must close at or very near the first candle’s low, and if it closes inside the first candle’s body the pattern is an in neck instead.
In-Neck Candlestick Pattern explains how a slight price difference creates a completely different signal.
How to trade the On-Neck pattern effectively?
Successful On-Neck trading strategies utilize the breakout below the second candle’s low as the primary entry trigger for short positions. This confirmation candle eliminates ambiguity and confirms trend resumption. Entry timing is critical for risk management.
Three execution steps define profitable On-Neck trading:
- Entry: At the break of the second candle’s low (confirming the trend resumption). Wait for this confirmation, entering during the second candle risks reversal traps.
- Stop-Loss: Placed just above the high of the second candle or the “Neckline.” This level protects against false breakouts and pattern failure.
- Profit Targets: Using the “Measured Move” (distance of the preceding downtrend). This projection provides realistic profit expectations.
Worked illustration of the rule:
An On-Neck pattern forms on a 4-hour chart inside an established downtrend, and Candle 2 closes at the low of Candle 1. The pattern alone is not the entry. The entry is the break of Candle 2’s low, the stop sits above Candle 2’s high, and the target is the measured move projected from the preceding leg. If Candle 2’s low holds, there is no trade. This is an illustration of the rule, not a record of a specific trade. Past performance is not indicative of future results.
Thomas Bulkowski’s on neck reference gives the tested definition and the measured behaviour, including the frequency and performance ranks.
Comparison: On-Neck vs. In-Neck vs. Piercing Patterns
The closing price of the second candle identifies the technical distinction between continuation and reversal signals. This single variable creates entirely different trading implications. Precision in pattern classification is essential for strategy selection.
| Pattern Type | Second Candle Close | Market Signal | Bulkowski tested behaviour |
| On-Neck | At/Near Prior Low | Bearish Continuation | Bearish continuation 56% |
| In-Neck | Slightly inside Body | Bearish Continuation | Bearish continuation 53% |
| Piercing | Above 50% of Body | Bullish Reversal | Bullish reversal 64% |
| Tasuki Gap | Beyond the Gap | Continuation | Not separately tested |
Tested behaviour from Thomas Bulkowski: on neck, in neck and piercing pattern. Piercing Line Pattern explains how to trade the opposite signal.
The On-Neck and the In-Neck sit close together in Bulkowski’s results, at 56% and 53% respectively, and both rank well for the strength of the move once it does break: 33rd and 17th of 103. The piercing pattern is the odd one out, a genuine bullish reversal 64% of the time, so it requires opposite positioning.
Piercing Line Pattern explains how to trade the opposite signal.
Reliability and Common False Signals
Volume confirmation and trend intensity determines the historical success rate of the On-Neck continuation pattern. Not all patterns are created equal, context matters enormously. Market environment selection improves outcomes significantly.
Two critical filters improve On-Neck win rates:
- The Volume Filter: Why the second candle should have lower volume than the first. High volume on the second candle suggests strong buyer commitment, negating the continuation signal.
- RSI Confirmation: Ensuring the RSI is not yet “Oversold” (<30) to allow for more downside. An oversold reading suggests reversal probability.
- High vs. Low Volatility: Why the pattern fails in “choppy” ranging markets. Defined trends are required for pattern reliability.
A Morning Star pattern forming after an On-Neck is a major warning signal; if the third candle after the pattern is strongly bullish, the continuation thesis is invalidated. Professional traders monitor this reversal signal carefully to prevent re-entry losses.
Technical Indicators for Trading explains how to layer confirmation filters effectively. Professional traders on the 2026 “Majors Desk” only trade On-Neck patterns that form on Daily or 4-Hour charts, ignoring lower-timeframe noise.
Bulkowski’s candlestick performance ranking ranks all 103 candle types by tested performance, which is the closest thing to a like-for-like reliability table that exists.
Turn Knowledge into Profit
You have done the reading, now it is time to act. The best way to learn is by doing. Open a free, no-risk demo account and practice your strategy with virtual funds today.
Open a Free Demo AccountPsychology of Trading Continuation Signals
Cognitive patience ensures that traders do not pre-empt the trend resumption before the structural confirmation candle closes. Impatience costs capital, early entry before confirmation creates excessive risk. Applying institutional Risk Management frameworks is the only way to survive failed continuation setups.
Two psychological pitfalls destroy On-Neck traders:
- Avoiding FOMO: The urge to enter during the “Star” or “Star-like” second candle. Resist this impulse and wait for confirmation below the neckline.
- Adhering to the “Stop-Loss” Discipline: In 2026 markets, speed of execution matters. Execute stops without hesitation when invalidation occurs.
Risk Management provides frameworks for position-level discipline. Common Trading Mistakes to Avoid identifies the behavioral patterns that destroy accounts.
Key Takeaways
- The On-Neck pattern is a two-candle formation that signals the continuation of a bearish trend.
- Candle identification requires a long red bar followed by a small green bar closing at the prior low.
- The Neckline represents a failed bullish support level where sellers regain control of the market.
- Entry confirmation occurs only when price breaks and closes below the low of the second candle.
- Stop-loss discipline involves placing orders above the high of the second candle to protect against reversals.
- Reliability is highest on 4-hour and daily charts when confirmed by decreasing volume on the second bar.
Frequently Asked Questions
This article contains references to On-Neck candlestick patterns, technical analysis, and Volity, a regulated CFD trading platform. This content is produced for educational purposes only and does not constitute financial advice or a recommendation to buy or sell any financial instrument. Candlestick pattern trading carries substantial risk due to pattern misidentification and false signals. Always test On-Neck strategies on a demo account before committing real capital. Some links in this article may be affiliate links.