Wyckoff accumulation is the sideways range where large operators quietly buy an asset from the public near the end of a downtrend, ahead of the markup that follows. It plays out through a recognisable schematic of phases and events, running from a selling climax to a spring, and learning to read it helps a trader get positioned for the uptrend that usually comes next.
What is Wyckoff accumulation?
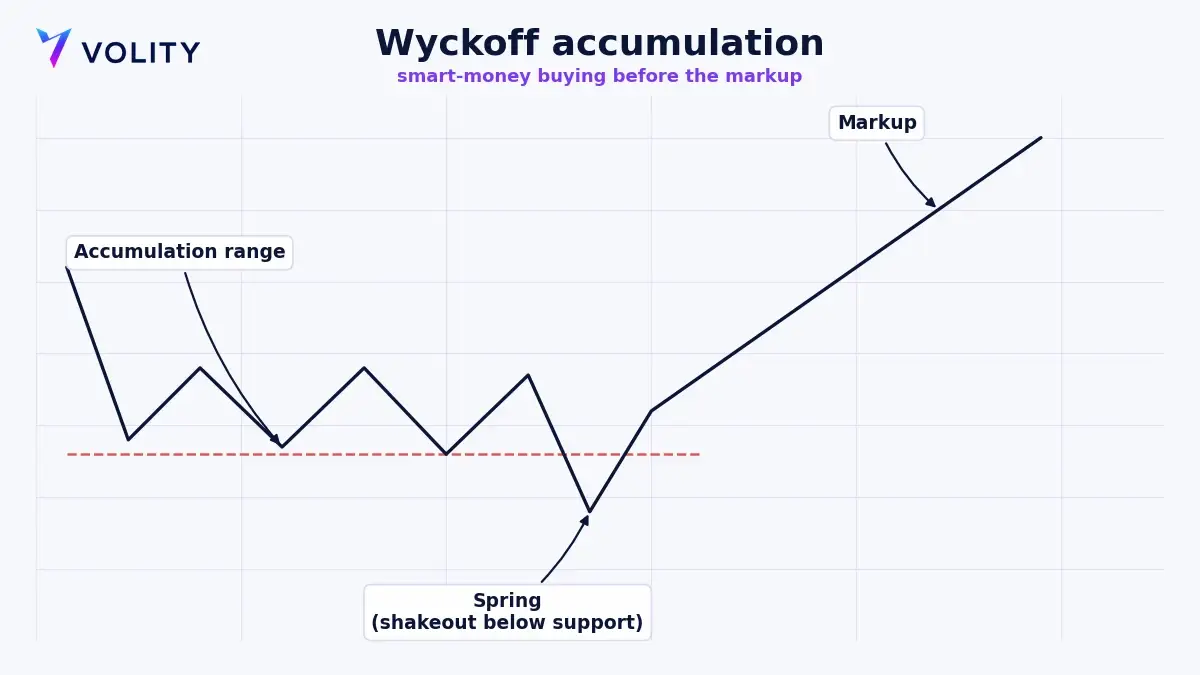
Wyckoff accumulation is the first stage of the market cycle that Richard Wyckoff mapped out almost a century ago. After a long decline, price stops falling and drifts sideways in a range. On the surface that looks like indecision. Underneath, in Wyckoff’s reading, large operators are absorbing supply, buying steadily from discouraged sellers without lifting price fast enough to give themselves away. The accumulation pattern is that whole transfer of stock from weak hands to strong, and it lays the base the later uptrend is built on. The wider cycle then runs through four stages, accumulation, markup, distribution and markdown, with accumulation as the floor under everything that comes after.
Who was Richard Wyckoff and what is the Composite Operator?
Richard D. Wyckoff was an early-twentieth-century trader, publisher and educator who studied how the most successful operators of his day moved markets. His main teaching device is the Composite Operator, an imaginary single player who stands in for all the large, informed money at once. Wyckoff told students to read the chart as if that operator were engineering every move on purpose, buying at the lows and selling at the highs. He also set out three laws that still hold the method together, supply and demand, cause and effect, and effort versus result. Modern smart money concepts are, in large part, a repackaging of this hundred-year-old work.
What does the Wyckoff accumulation schematic show?
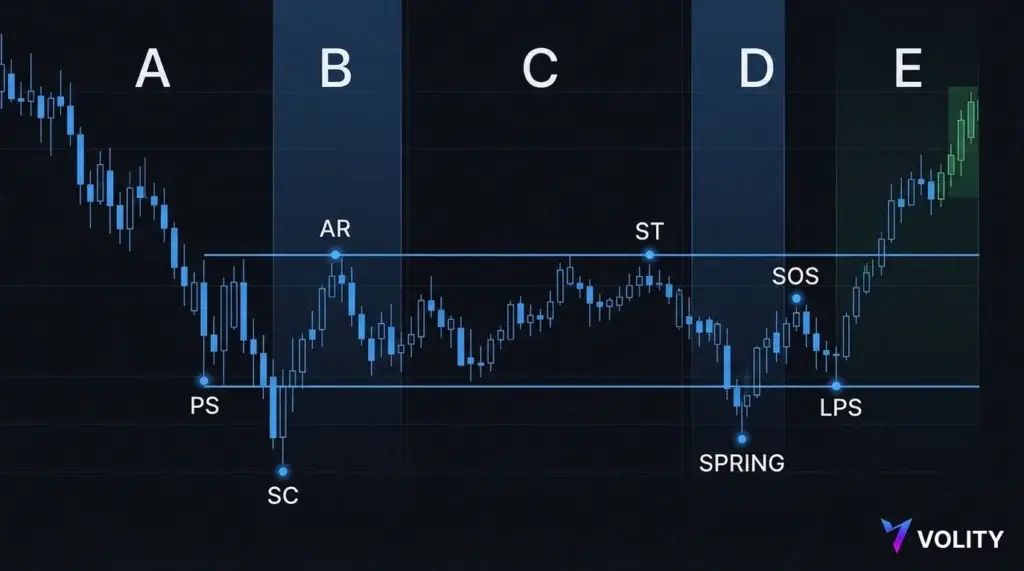
The Wyckoff accumulation schematic is the textbook map of the range. It splits the range into five phases labelled A through E and marks the events that show up along the way. There are two common versions of the schematic. In one, the low-risk buying test, the spring, dips below support; in the other it does not. Both describe the same story of supply being absorbed. The events, in order, are usually preliminary support, the selling climax, the automatic rally, the secondary test, the spring or shakeout, the sign of strength, and the last point of support.
What are the phases of Wyckoff accumulation?
- Phase A stops the decline. Preliminary support and a selling climax show heavy selling being absorbed, followed by an automatic rally off the low and a secondary test back down toward it.
- Phase B builds the cause. This is the long, choppy middle of the range where the operator does most of the accumulating, with price swinging between support and resistance while supply is quietly worked off.
- Phase C is the test, usually a spring or shakeout. Price dips below the range low to trip stops and check for leftover supply, then snaps back inside. It is the classic low-risk entry.
- Phase D is where the trend appears. Demand takes control, signs of strength break resistance, and pullbacks make higher lows at the last point of support.
- Phase E is the markup. Price leaves the range and trends up, accumulation finished and the uptrend under way.
What are the key events in the accumulation pattern?
- PS, preliminary support, is the first meaningful buying after a long fall, an early hint that the decline is tiring.
- SC, the selling climax, is panic selling into strong hands, often a wide bar on heavy volume, and it marks the low of the range.
- AR, the automatic rally, is the sharp bounce once selling dries up, and it sets the top of the range.
- ST, the secondary test, is a return toward the selling-climax low on lighter volume, confirming supply has thinned.
- The spring is a dip below support that fails and reverses, shaking out weak holders just before the markup.
- SOS, the sign of strength, is a strong rally that breaks resistance and shows demand now has the upper hand.
- LPS, the last point of support, is a higher low on a pullback, the final low-risk entry before the trend runs.
How do you trade Wyckoff accumulation?
The method rewards patience. You read the range as market structure and wait for evidence that supply is exhausted rather than guessing the bottom.
- Find a trading range forming after a clear downtrend, and mark support and resistance.
- Wait for Phase A to confirm the decline has stopped, with a selling climax, an automatic rally and a secondary test.
- Let Phase B play out, and resist forcing trades in the choppy middle of the range.
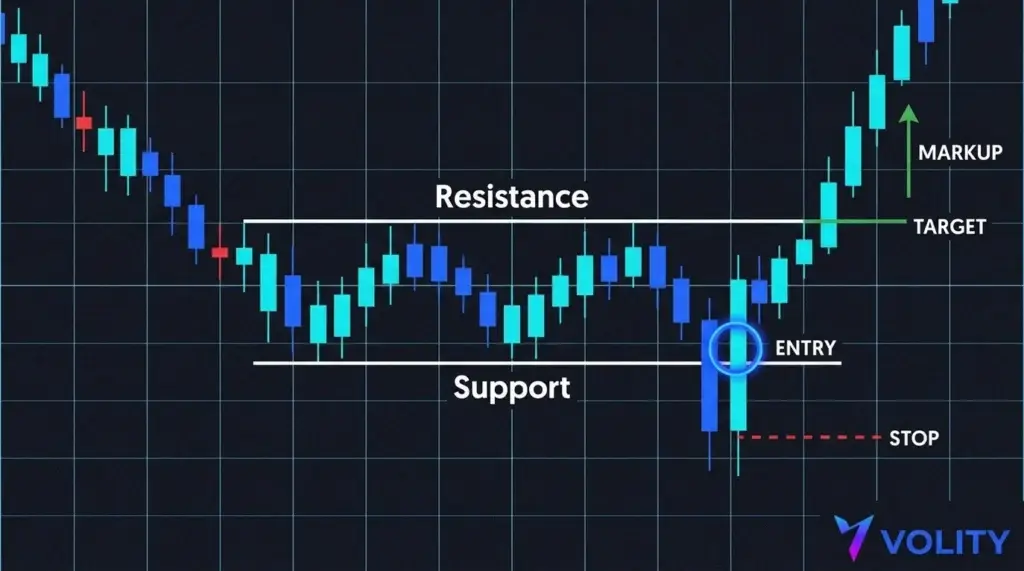
- Look for the Phase C spring, a dip below support that reverses back inside on strong demand.
- Enter on the spring reversal or at the last point of support in Phase D, with a stop just below the spring low.
- Target the top of the range first, then trail the position as the Phase E markup develops.
How does accumulation differ from distribution?
| Feature | Wyckoff accumulation | Wyckoff distribution |
| Location | After a downtrend, near lows | After an uptrend, near highs |
| Operator activity | Buying from the public | Selling to the public |
| Signature test | Spring (dip below support) | Upthrust (spike above resistance) |
| What follows | Markup (uptrend) | Markdown (downtrend) |
Accumulation and distribution are mirror images. Wyckoff distribution is the same range logic turned upside down at the top of a trend, so learn one thoroughly and the other becomes easy to read.
What are the risks, and where can you trade Wyckoff setups?
Ranges are treacherous. Not every range is accumulation, some resolve straight down, and a spring can fail and keep falling. Wait for confirmation, respect the stop below the spring low, and never average down into a range that keeps breaking. These setups are usually traded with leverage through contracts for difference, which magnifies losses as well as gains, so size every position from its stop distance. Handle leverage carefully and set the size from the stop distance, never the other way round. On Volity you can trade Wyckoff setups across forex, indices, crypto and commodities on Volity MT, with spreads from 0.6 pips, 99.6% of orders filled in under a second, and leverage up to 1:500 on selected forex pairs, all under CySEC regulation through UBK Markets (licence 186/12). Opening an account costs nothing, you can practise on a free demo, and you can go live from $1. Check your costs against the published charges and fees before you commit.
Related patterns
Frequently asked questions about Wyckoff accumulation
How many phases does Wyckoff accumulation have?
The classic accumulation schematic has five phases, labelled A through E: stopping the decline, building the cause, the test or spring, the trend appearing, and the markup. Separately, the broader Wyckoff market cycle has four stages, accumulation, markup, distribution and markdown, so the two counts describe different things.
What is the spring in Wyckoff accumulation?
The spring is a Phase C move that dips below the range support, trips stop orders, and then reverses back inside. It shakes out weak holders and tests for any supply that is left. A successful spring is one of the lowest-risk entries in the whole accumulation pattern.
Is Wyckoff accumulation reliable?
It is a framework, not a guarantee. The schematic describes a common way ranges resolve, but plenty of them break the other way. Reliability improves when you wait for confirmation, read volume alongside price, and combine the pattern with the rest of your technical analysis and sound risk management rather than trading it blindly.
What markets does Wyckoff accumulation apply to?
Wyckoff developed the method on stocks, but the logic of supply and demand carries over to any liquid market, including forex, indices, gold and crypto. The clearest schematics show up on liquid instruments with reliable volume, where large operators leave visible footprints. It reads the same on a technical chart whatever the instrument.