Wyckoff distribution is the sideways range where large operators quietly sell an asset to the public near the end of an uptrend, just before a markdown. It plays out through a recognisable schematic of phases and events, from a buying climax to an upthrust, and reading it early helps a trader step aside or position short ahead of the decline that tends to follow.
What is Wyckoff distribution?
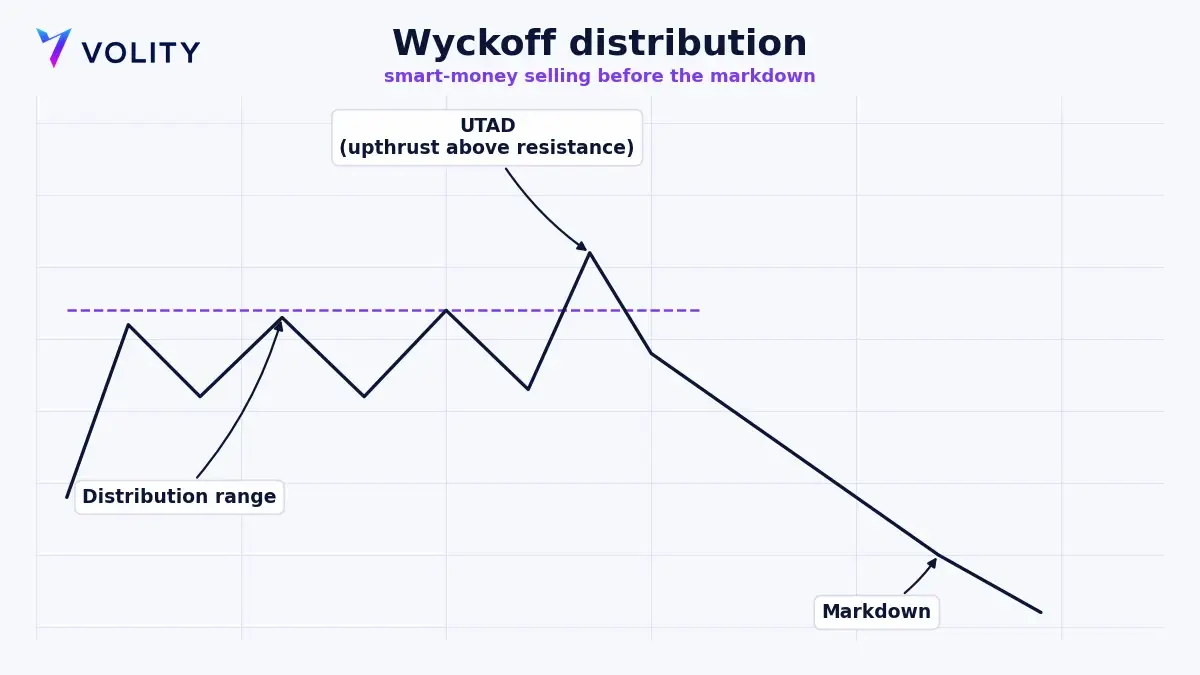
Wyckoff distribution is the mirror image of accumulation, and it sits at the top of the market cycle. After a long advance, price stops rising and drifts sideways in a range. It can look like a healthy pause, yet in Richard Wyckoff’s method the large operators he called the Composite Operator are offloading the positions they built far lower, feeding stock to an eager public without cracking the price too soon. The pattern is that whole transfer from strong hands back to weak. This is the distribution phase that caps an uptrend, and once the operators have sold what they wanted, support gives way and the markdown begins. Reading the range is really a lesson in following smart money instead of the crowd.
What does the Wyckoff distribution schematic show?
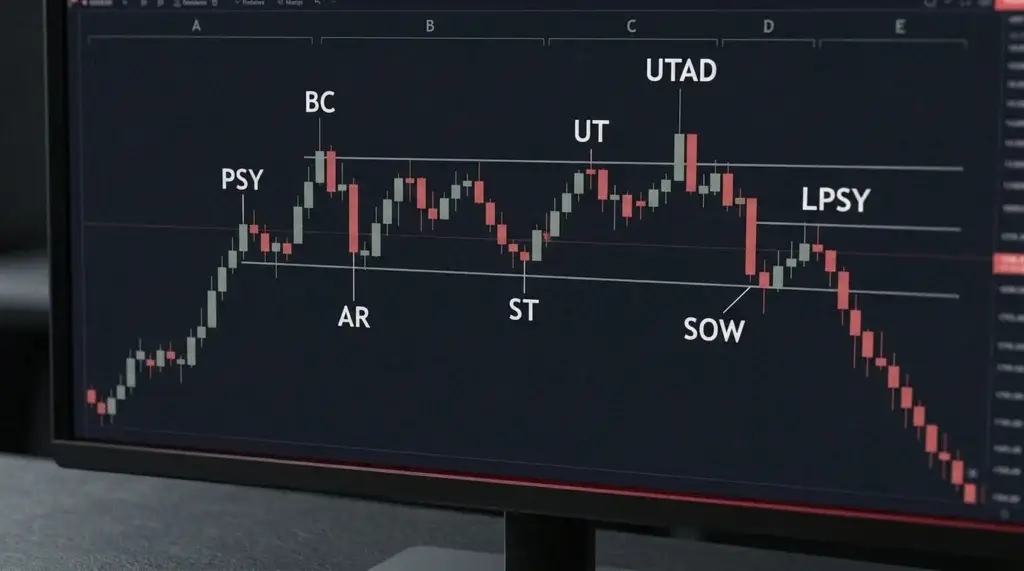
The Wyckoff distribution schematic maps the range into five phases, labelled A through E, and marks the events along the way. As with accumulation, there are two common versions of the schematic, separated mainly by whether the Phase C test spikes above resistance. Both describe the same process of supply being handed off. The events, in rough order, run from preliminary supply and the buying climax through the automatic reaction and secondary test, then the upthrust and the upthrust after distribution, and finally the sign of weakness and the last point of supply. Sound technical analysis reads those events against the range’s support and resistance lines rather than in isolation.
What are the phases of Wyckoff distribution?
- Phase A stops the advance. The uptrend stalls as preliminary supply and a buying climax meet climactic demand with heavy selling, and an automatic reaction with a secondary test then frames the range.
- Phase B builds the cause. Across a long stretch the operator distributes stock, price swings between support and resistance, and the odd upthrust probes for buyers above the highs.
- Phase C brings the test. An upthrust after distribution pushes above resistance to trap breakout buyers, then falls back inside the range. It is the mirror of the accumulation spring.
- Phase D is where the trend shows its hand. Supply takes control, signs of weakness break support, and rallies fail at lower highs near the last point of supply.
- Phase E is the markdown. Price leaves the range to the downside and trends lower, the distribution complete and the downtrend underway.
What are the key events in the distribution pattern?
- Preliminary supply (PSY) is the first notable selling after a long advance, an early hint the rise is tiring.
- The buying climax (BC) is climactic buying on wide spread and high volume, absorbed by large sellers, and it marks the high of the range.
- The automatic reaction (AR) is a sharp drop once demand fades, and it sets the low of the range.
- The secondary test (ST) is a rally back toward the buying climax high on lighter volume, confirming demand has weakened.
- The upthrust (UT) is a push above resistance that fails and slips back inside the range.
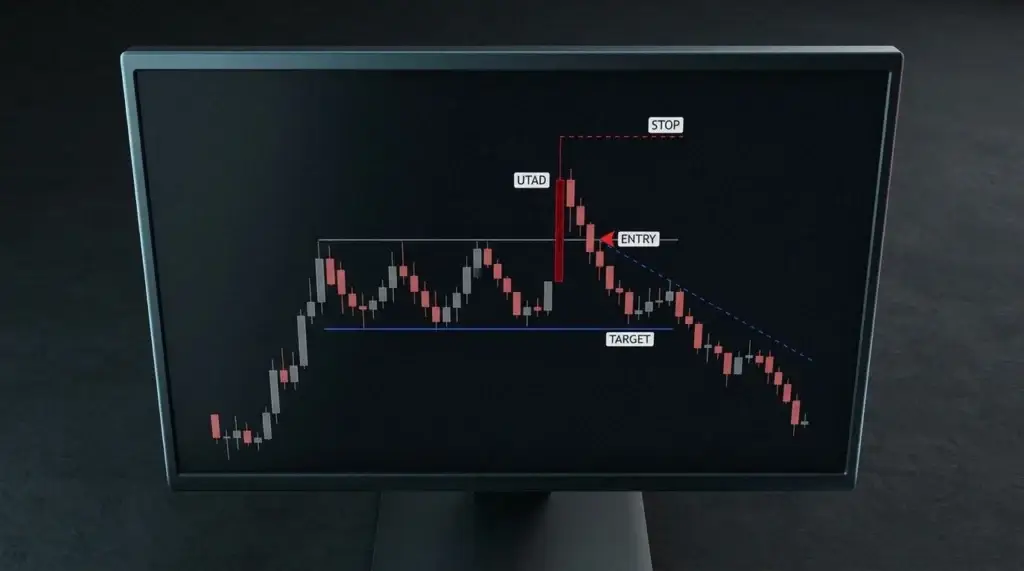
- The upthrust after distribution (UTAD) is the Phase C test, a spike above resistance that traps breakout buyers before reversing.
- The sign of weakness (SOW) is a decline that breaks support on rising spread and volume, proof that supply now dominates.
- The last point of supply (LPSY) is a weak, low-volume rally to a lower high, the final low-risk short before the markdown.
How do you trade Wyckoff distribution?
You wait for evidence that demand is exhausted instead of trying to pick the exact top.
- Find a trading range forming after a clear uptrend, and mark support and resistance.
- Let Phase A confirm the advance has stalled through a buying climax, an automatic reaction and a secondary test.
- Watch Phase B for upthrusts that fail, the tell that supply is present in the range.
- Look for the Phase C upthrust after distribution, a spike above resistance that reverses back inside.
- Enter short on that reversal, or on a last point of supply in Phase D, with a stop above the upthrust high.
- Target the bottom of the range first, then trail the stop as the Phase E markdown develops.
The same read works on any liquid market, and it shows up cleanest on a well-defined trading range where the swing highs and lows are obvious.
How does distribution differ from accumulation?
| Feature | Wyckoff distribution | Wyckoff accumulation |
| Location | After an uptrend, near highs | After a downtrend, near lows |
| Operator activity | Selling to the public | Buying from the public |
| Signature test | Upthrust above resistance | Spring below support |
| What follows | Markdown (downtrend) | Markup (uptrend) |
Distribution and accumulation are two sides of the same coin, opposite phases of the same market structure. If you can read one with confidence, you can read the other by flipping the logic: the spring below support in accumulation becomes the upthrust above resistance in distribution.
What are the risks, and where can you trade Wyckoff setups?
Distribution is hard to trade because a strong uptrend can keep printing higher highs, and an upthrust can turn into a real breakout. Never short a rising market on the pattern alone; wait for a confirmed sign of weakness and keep a stop above the upthrust high. Because forex and other major markets are so deep and liquid, large operators can distribute size without tipping their hand, which is part of why the footprints only become obvious after the fact. These setups are usually traded with leverage through contracts for difference, which lets you go short as easily as long but magnifies losses as much as gains. Cap the risk on every trade and size the position from its stop distance. On Volity you can trade Wyckoff patterns across forex, indices, crypto and commodities on Volity MT, with spreads from 0.6 pips, 99.6% of orders filled in under a second, and leverage up to 1:500 on selected forex pairs, all regulated by CySEC through UBK Markets (licence 186/12). Confirm your costs against the published charges and fees and rehearse on a free demo before you trade live.
Related patterns
Frequently asked questions about Wyckoff distribution
What is the difference between an upthrust and a spring?
An upthrust is the distribution test, a spike above resistance that traps breakout buyers and then reverses down. A spring is the accumulation test, a dip below support that traps sellers and reverses up. Both shake the crowd out before the real move, only in opposite directions.
How do you confirm Wyckoff distribution?
Confirmation comes in Phase D, when price breaks range support on a clear sign of weakness with rising spread and volume, and the rallies that follow fail at lower highs. Until support breaks, the range can still resolve upward, so patient confirmation beats an early guess.
Is Wyckoff distribution reliable?
It describes a common topping process, but no pattern is a sure thing and some ranges simply carry on higher. Reliability improves when you read candlestick volume alongside price, wait for the sign of weakness, and hold to strict risk management instead of shorting just because a range looks toppy.
What markets does Wyckoff distribution apply to?
Wyckoff built the method on stocks, yet the supply-and-demand logic carries to any liquid market, including forex, indices, gold and crypto, wherever price discovery leaves a clear trail. The cleanest distribution schematics show up on instruments with dependable volume, where large operators leave readable footprints near the highs.