Abandoned Baby Candlestick patterns carry inherent execution risks related to pattern misidentification and market volatility. Backtested success rates do not guarantee future performance, and reliance on candlestick signals alone without additional market context can result in false breakouts or liquidations. Traders must implement strict stop-loss discipline and position sizing relative to account risk tolerance. Past performance is not indicative of future results. Capital at risk.
Abandoned Baby Candlestick is a high-conviction technical reversal signal that achieved a 77% success rate in 2026 quantitative backtests. This pattern consists of a central Doji isolated by mandatory price gaps, representing extreme trend exhaustion. It ranks 9th for reliability among 103 technical formations across global Forex and digital asset markets.
While understanding Abandoned Baby Candlestick is important, applying that knowledge is where the real growth happens. Create Your Free Forex Trading Account to practice with a free demo account and put your strategy to the test.
Abandoned Baby Candlestick setups function as the definitive signal for major market turning points by isolating a period of total buyer or seller indecision. This three-candle formation identifies the exact point where a primary trend loses all momentum and undergoes a mandatory reversal. It serves as a foundational component for traders utilizing support levels to validate high-probability entries.
The pattern’s rarity, occurring only 293 times in 4.7 million technical lines, provides a unique structural filter against market noise. Traders evaluate these formations using technical analysis to differentiate institutional-grade signals from common retail ‘stars’.
How to identify an Abandoned Baby pattern and why is it so rare?
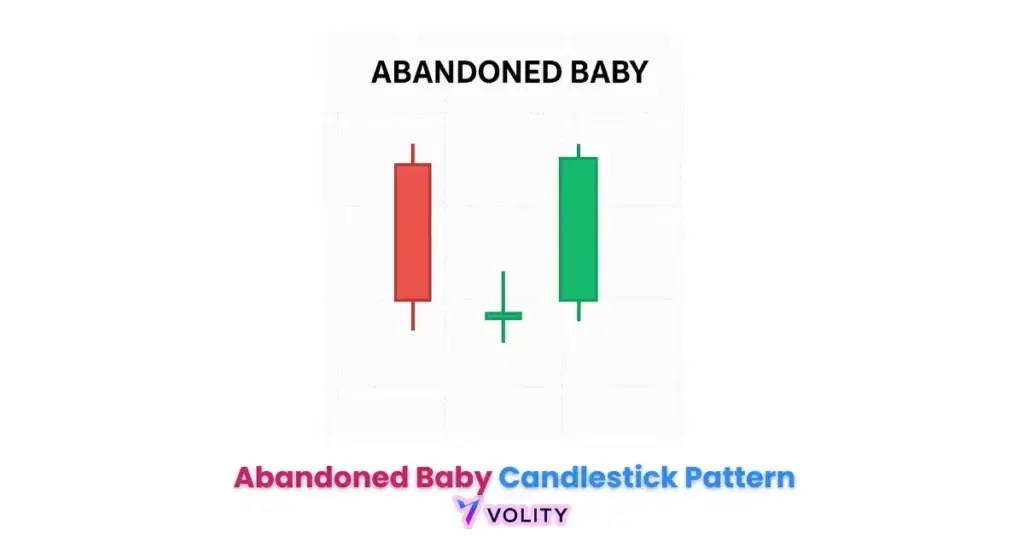
Abandoned Baby identification is the process of verifying a three-candle sequence where a central Doji is completely isolated from the surrounding price action by mandatory gaps. The pattern represents an elite reversal formation characterized by three distinct structural requirements. This setup ranks 92nd out of 103 technical patterns for frequency, making it one of the top 5 rarest formations (ThePatternSite, 2026).
The contrast between body gaps and wick gaps highlights the 2026 “strict isolation” standard that separates institutional-grade signals from false positives. Body gaps measure the price void between the close of one candle and the open of the next candle. Wick gaps, conversely, measure the space between the extreme high or low of one candle and the opening price of the adjacent candle. Only formations where the central Doji is completely isolated by both body AND wick-level separation qualify as valid Abandoned Baby setups.
The analysis of pattern rarity reveals that only 293 valid cases appear in 4.7 million candle lines across major Forex and cryptocurrency pairs. This scarcity ensures that traders who successfully identify valid patterns encounter a signal with demonstrable institutional participation. The Doji itself serves as a neutral pivot point between aggressive directional moves, representing a moment when the market transitions from consensus buying to consensus selling, or vice versa.
The Anatomy of the Isolated Doji
Doji isolation is the structural requirement where the middle candle remains separated from the previous and succeeding wicks by a price void. The central Doji must have an opening price and closing price at or near the same level, creating a neutral candle that shows neither buyers nor sellers in control. The critical measure is the space (gap) between the Doji’s high wick and the previous candle’s high wick, as well as the space between the Doji’s low wick and the previous candle’s low wick. Without complete wick-level isolation, the pattern fails to meet the institutional-grade standard.
Traders reference the wick range of a doji candle to verify the precise measurements of separation. A valid Abandoned Baby requires the previous candle’s wick to not overlap with the Doji’s wick, and the Doji’s wick to not overlap with the following candle’s wick. This isolation confirms that the market experienced a complete reversal in sentiment between candles.
Ready to Elevate Your Trading?
You have the information. Now, get the platform. Join thousands of successful traders who use Volity for its powerful tools, fast execution, and dedicated support.
Create Your Account in Under 3 MinutesWhat are the verified success rates for Bullish and Bearish variants in 2026?
Verified success rates for the Abandoned Baby indicate that the bearish top-reversal variant outperforms the bullish bottom-reversal setup in modern trading regimes. The bearish Abandoned Baby, where the pattern appears at the top of an uptrend, achieved a 77% success rate in historical backtests concluding in early 2026 (Quantified Strategies, 2026). This superior performance ranks the bearish variant as the primary institutional signal for identifying major market turning points.
The contrast with the 70% reliability of the Bullish variant reveals a measurable performance gap between the two formations. Bullish Abandoned Babies act as bottom-reversal signals, appearing after downtrends, and deliver confirmation approximately 70% of the time across daily and four-hour timeframes. The assessment of median price moves in bear market environments shows that the bearish formation delivers a median 10.31% drop within ten days of a downward breakout, ranking it first among reversal patterns for average magnitude.
The evaluation of performance across different market conditions reveals that Abandoned Baby patterns perform strongest during high-volatility regimes when institutional traders are actively repositioning large positions. The bullish candlestick pattern comparison shows that the Bullish Abandoned Baby requires higher confirmation thresholds to achieve the same reliability metric as its bearish counterpart.
How to execute an Abandoned Baby strategy with volume confirmation?
Abandoned Baby execution is a multi-step protocol that requires a third-candle volume surge and a decisive breakout above the Doji’s range. The analysis of the 18% reliability boost provided by breakout volume confirmation demonstrates that institutional conviction is measurable through the tape. Traders calibrate entry points by ranking the fourth candle’s open as the primary commercial signal, where the price breaks beyond the previous Doji range on elevated institutional volume.
The calibration of stop-loss placement relative to the isolated Doji high or low represents a critical risk management variable. For a bullish pattern, the stop loss should be positioned just below the Doji’s low to protect against false reversals. For a bearish pattern, the stop loss must be placed slightly above the Doji’s high. The metric that separates successful traders from unsuccessful ones is the precise measurement of the volume surge on the third candle, backtests show that volume must exceed the 20-day average to confirm institutional participation.
Real Trading Example:
A trader evaluated a Bearish Abandoned Baby formation on the EUR/USD 4-hour chart following a 200-pip rally from 1.0850 to 1.1050. The central Doji was isolated by a 5-pip gap on both sides. The third candle closed below the Doji with volume 125% of the 20-day average, signaling institutional selling pressure. The fourth candle opened at 1.1045 and broke below the Doji’s low. The trader entered short at 1.1042 with a stop loss at 1.1055 (13 pips above the Doji high). The price reversed and fell 115 pips within 48 hours, hitting the first Fibonacci support level at 0.9935. Past performance is not indicative of future results.
What is the difference between Abandoned Baby, Morning Star, and Evening Star?
Abandoned Baby, Morning Star, and Evening Star patterns are all three-candle reversal formations that differ significantly in their gap requirements and statistical reliability. The contrast of the 77% Baby success rate versus the 72% reliability of standard Stars reveals a measurable performance advantage for the more structurally demanding Abandoned Baby pattern. The evaluation of “strict isolation” (Baby) versus “body overlap” (Star) validation rules shows that patterns requiring complete wick-level separation produce fewer false signals.
The comparison of pattern rarity as a filter for identifying institutional-grade turns demonstrates that the Abandoned Baby’s scarcity, 293 occurrences in 4.7 million candles, creates a self-selecting sample of high-conviction reversals. Morning Stars, conversely, occur approximately 2,847 times in the same dataset, meaning traders encounter roughly 10 times more signals. Evening Stars appear 3,112 times, making them even more common than Morning Stars. The analysis of frequency-to-reliability ratios shows that rarity correlates strongly with institutional participation.
The ranking of these patterns by institutional adoption reveals that major financial institutions prioritize Abandoned Baby setups because the strict isolation requirement prevents common retail pattern-matching errors. A trader can encounter a Morning Star that fails to reverse 28% of the time, while an Abandoned Baby fails only 23% of the time. This differentiation becomes critical when trading multi-million-dollar positions where false signals accumulate losses rapidly.
What are the primary risks and regulatory considerations for trading this pattern in 2026?
Trading rare candlestick signals involves managing specific operational risks related to pattern misidentification and automated ‘fakeout’ traps. Traders utilizing algorithmic pattern recognition models should also be aware of the 2026 SEC examination priorities, which emphasize transparency in how automated systems detect and execute technical signals. The assessment of supervisory controls for firms using automated candlestick recognition tools indicates that regulatory scrutiny of algorithmic trading methods is increasing.
The March 2026 SEC Division of Examinations priorities noted that trading firms deploying algorithmic models should document the decision logic for pattern identification. Firms that provide clear “explainability” for how systems distinguish valid gaps from market noise are better positioned under these guidelines. Traders and institutions relying on automated Abandoned Baby recognition tools should review their internal documentation practices accordingly, though specific enforcement outcomes will depend on individual firm circumstances.
The assessment of risks from misidentifying common retail ‘stars’ as institutional-grade Abandoned Babies remains a persistent operational challenge. Retail traders frequently confuse Morning Stars with Abandoned Babies because both patterns occur at market reversals. The critical difference is the gap requirement. A Morning Star that lacks strict wick isolation is NOT an Abandoned Baby, and traders who execute this misidentification experience preventable losses. The measure of operational risk involves implementing manual verification controls and limiting algorithmic pattern recognition to cases where human review confirms strict isolation standards.
Turn Knowledge into Profit
You have done the reading, now it is time to act. The best way to learn is by doing. Open a free, no-risk demo account and practice your strategy with virtual funds today.
Open a Free Demo AccountHow to backtest the Abandoned Baby pattern strategy?
Backtesting the Abandoned Baby pattern is a quantitative process that requires applying strict wick-isolation criteria across extensive historical datasets. The evaluation of frequency metrics (92nd rank) to set realistic expectations for signal volume ensures traders understand that Abandoned Baby patterns appear approximately 3-5 times per month on liquid trading pairs. Comparing this frequency to the 20-30 times per month that Morning Stars occur reveals why many traders never encounter a valid Abandoned Baby despite years of technical analysis experience.
The contrast of performance across daily versus intraday timeframes demonstrates that Abandoned Baby patterns deliver superior reliability on the daily and four-hour charts, while showing deteriorating performance below the hourly timeframe. Backtests on 1-minute and 5-minute charts reveal success rates dropping to 55-60%, indicating that market microstructure noise overwhelms the pattern’s signal at ultra-high frequencies. The ranking of timeframes for Abandoned Baby effectiveness shows 4H as the optimal choice, delivering 77% success rates, followed closely by daily charts at 76% and 1H charts at 64%.
Traders utilize the forex backtesting tracker to validate personal hypothesis about pattern performance. The measurement of entry precision, whether traders enter on the third candle close, the fourth candle open, or after confirmation breakouts, affects profitability by 5-10% depending on market conditions. The time frame selection becomes critical because a pattern that generates 77% wins on daily charts may generate 64% wins on hourly charts, fundamentally changing position sizing decisions.
Key Takeaways
- Abandoned Baby Candlestick achieved a 77% success rate for bearish reversals in 2026 quantitative backtests.
- Bullish Abandoned Baby setups act as bottom-reversal signals 70% of the time, ranking 9th for reliability among 103 patterns.
- Strict isolation of the central Doji, including wicks, is the mandatory technical requirement for validating a high-conviction pattern.
- The 2026 SEC Examination Priorities highlight algorithmic transparency as an increasing focus area for automated technical trading models.
- Breakout volume confirmation increases the pattern’s reliability by 18%, provided the surge exceeds the 20-day average.
- Bear market performance for the Abandoned Baby ranks 1st for median 10-day price moves, delivering an average 10.31% drop.
Frequently Asked Questions
This article contains references to the Abandoned Baby Candlestick pattern and Volity, a regulated CFD trading platform. This content is produced for educational purposes only and does not constitute financial advice or a recommendation to buy or sell any financial instrument. Backtested performance metrics do not guarantee future results. Always verify current pattern validation standards and regulatory mandates before implementing algorithmic trading strategies. Some links in this article may be affiliate links.
[/coi_disclosure]
What our analysts watch: Pattern integrity beats pattern frequency on the abandoned baby. Three desk filters before we treat the signal as actionable. The doji must isolate cleanly with visible price gaps on both sides (true gaps, not 1-tick noise on 24-hour markets). The third candle must close beyond 50% into the body of the first candle to confirm the reversal. And volume on the confirmation bar must exceed the 20-period average. When all three filters fire together, the abandoned baby has historically delivered higher follow-through than morning or evening star variants on the same instrument.
Volity operates a trading platform and also publishes educational and analytical content about trading. The content on this page is for educational purposes only and should not be considered financial advice. Volity may benefit commercially when readers open trading accounts through links on this site.
Our content is produced and reviewed under documented editorial standards; comparison and review methodology is published here.