A market structure shift (MSS) is the first time price closes through the swing point that was holding a trend: the last higher low in an uptrend, or the last lower high in a downtrend. It warns that the trend may be turning. It does not prove it. This guide gives you a written test, a real EUR/USD example with dates, and a way to practise the read on a demo before you risk money.
TL;DR: Mark the protected swing, the higher low that produced the latest high in an uptrend. A candle close through it is a market structure shift. A wick that closes back inside is not. On ECB fixings, EUR/USD broke its 1.1578 swing low on 14 September 2026 and fell 401 pips by 7 October, with no retest of the broken level. Treat a shift as a warning, size from your stop, and test your rule on a demo.
The term comes from ICT (Inner Circle Trader) and smart-money teaching, but the idea is older: trends are read through the order of highs and lows. The example below uses European Central Bank (ECB) reference rates, read on 11 November 2026.
What a market structure shift means on a chart
Market structure is the pattern of swing highs and swing lows. A swing high is a peak with lower prices on both sides. A swing low is a trough with higher prices on both sides. StockCharts states the rule for an uptrend line simply: “The second low must be higher than the first.” For a downtrend line, “The second high must be lower than the first.” (StockCharts ChartSchool, read 11 November 2026).
The swing a trend must hold is often called the protected swing. In an uptrend it is the higher low that launched the latest higher high. While price stays above it, the uptrend is intact. When a candle closes below it, the structure has shifted, and that close is the market structure shift. In a downtrend the logic flips: the protected swing is the last lower high, and a close above it is the shift.
Vendor guides from ATAS, TMGM, LuxAlgo and FXOpen describe it the same basic way: a break of the last swing against the trend. So in trading, “market shift” usually means this narrow chart event. The order of highs and lows changes direction.
How to identify a market structure shift, step by step
Write the test down before you open a live chart, and use it every time.
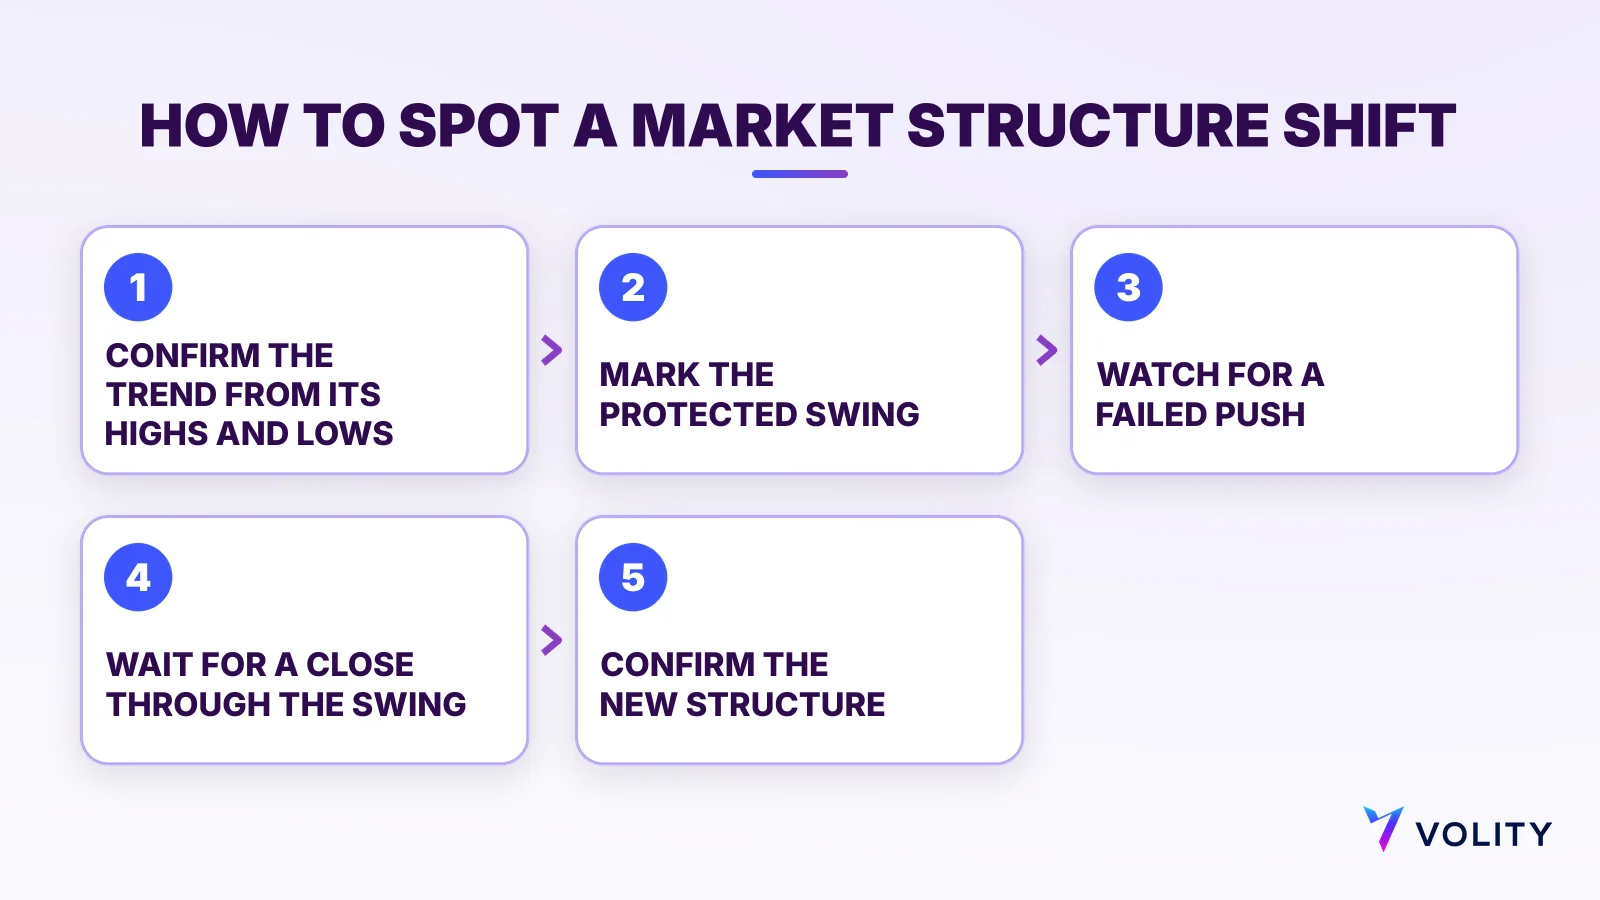
- Confirm the trend. Find at least two higher highs and higher lows for an uptrend, or two lower highs and lower lows for a downtrend.
- Mark the protected swing. In an uptrend it is the higher low that produced the most recent higher high. In a downtrend it is the lower high that produced the latest lower low.
- Watch for a failed push. An uptrend that prints a lower high instead of a new higher high is losing force. This step is optional, but it often comes first.
- Require a close through the protected swing. Decide in advance which candle you judge: hourly, four-hour or daily.
- Judge the break. Many teachers want displacement, a fast, large move through the level. Note it, but do not treat it as proof.
- Wait for the new structure. The first lower high after the break, in a new downtrend, confirms that the old pattern has changed.
A wick is the thin line above or below a candle’s body, showing how far price reached before the close. A wick through the swing that closes back inside fails step 4.
Market structure shift vs break of structure and change of character
A break of structure (BOS) goes with the trend. In an uptrend, price closes above the last swing high and the trend continues. A market structure shift breaks the other way. Change of character (CHoCH) is a third label. Some guides use it for the first sign of a turn and keep MSS for a confirmed one, while others treat the two as the same thing. Vendor guides disagree here, so fix your own definition and keep it.
| Event | Which way the close breaks | What it suggests | Typical response |
|---|---|---|---|
| Break of structure | With the trend, past the last swing | The trend continues | Hold trend trades |
| Market structure shift | Against the trend, through the protected swing | The trend may be reversing | Stop trend trades, plan the other side |
| Change of character | Against the trend, often the first break | Behaviour is changing | Used loosely, sometimes as MSS |
| Pullback | No close beyond the protected swing | The trend is intact | No signal |
A real example: EUR/USD, August to October 2026
The ECB publishes a euro reference rate for the US dollar every working day, a fixing set at 14:10 CET. The figures below come from the ECB data API, also shown on the ECB EUR/USD page. A fixing is one price a day, not a candle close, so intraday highs and lows are missing. A swing here is a fixing that is the lowest or highest of three days each side.
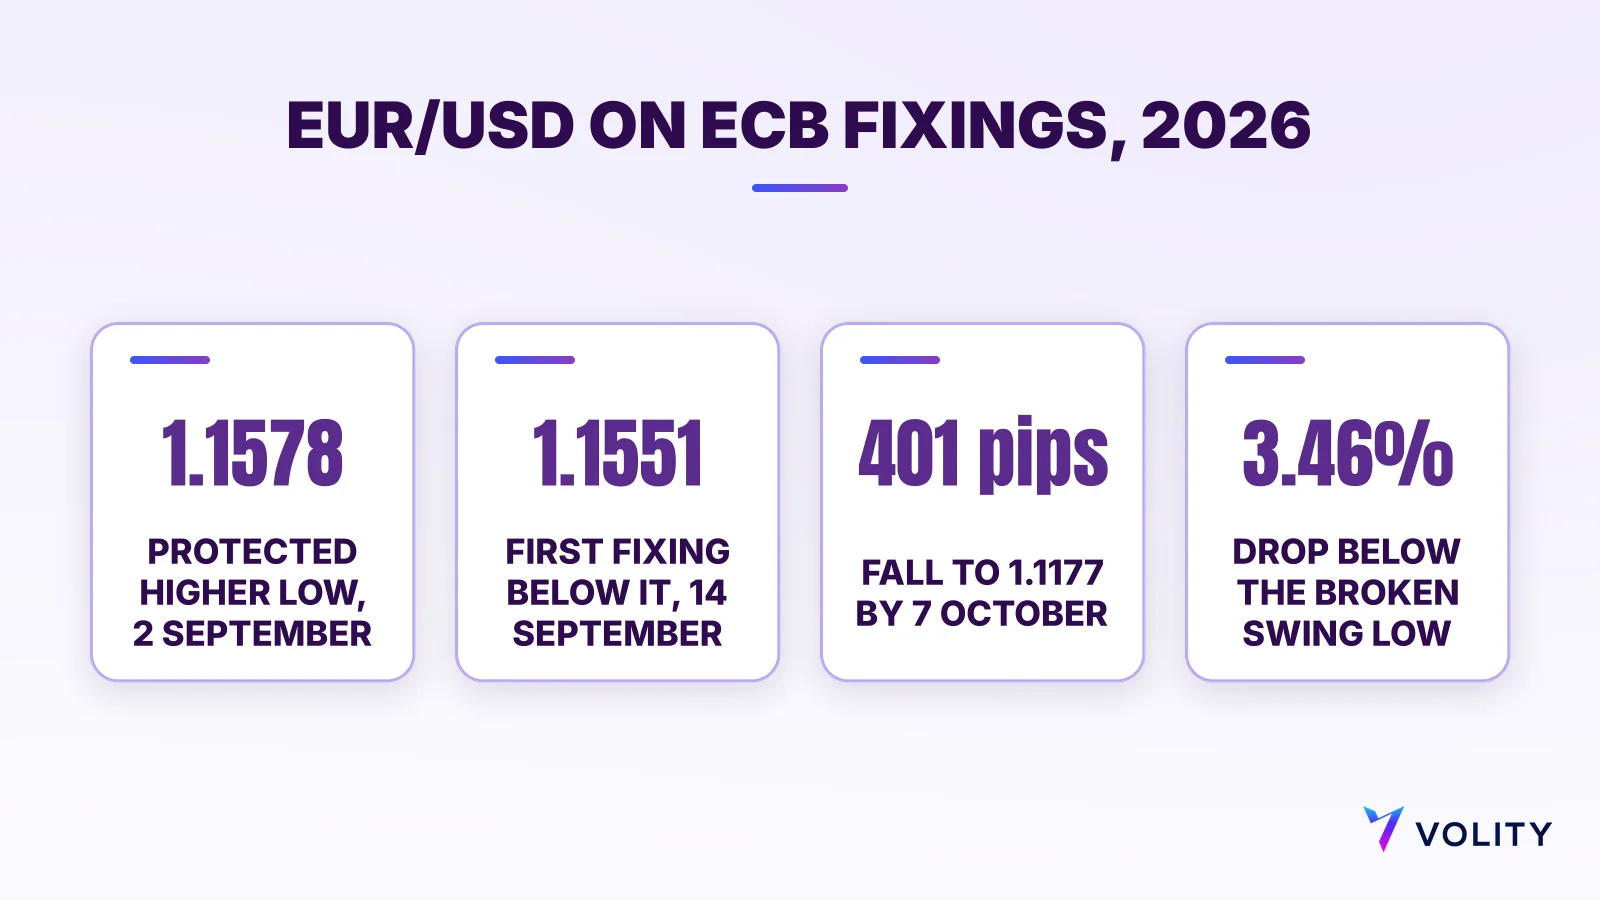
The uptrend came first. EUR/USD made a swing low at 1.1534 on 13 August 2026 and a swing high at 1.1699 on 21 August. It then pulled back to a higher low of 1.1578 on 2 September. That higher low became the protected swing.
Then the push failed. The next rally stopped at 1.1652 on 9 September, 47 pips under the 1.1699 high. A pip is the fourth decimal place of the rate, 0.0001, and it is how traders count small moves. The uptrend had not made a higher high.
The shift followed. Fixings fell to 1.1616 on 10 September and 1.1592 on 11 September, both still above 1.1578. On 14 September the fixing was 1.1551, 27 pips through the protected low. On this data, that is the market structure shift.
The fixings kept falling to 1.1177 on 7 October. That is 401 pips, or 3.46%, below the broken swing low, and 374 pips below the 1.1551 fixing on the day of the shift. A new downtrend structure then formed, with a lower high of 1.1253 on 16 October and a lower low of 1.1130 on 29 October.
One detail matters for entries. After 14 September, no fixing returned to 1.1578. The highest, 1.1539 on 15 September, stayed below it. On the fixings, a trader waiting for a retest of the broken level never got one.
Planning an entry after the shift
A shift tells you the trend may have turned. It does not give you an entry. Traders usually either sell on the break or wait for price to return to the broken level. The plans below reuse the ECB fixings as a hypothetical exercise.
Plan A, sell on the break. Say you sell at 1.1551 with a stop just above the 1.1652 lower high. The stop is 101 pips away. A target of twice the risk, a 1:2 risk-reward ratio, sits 202 pips lower at 1.1349. The first fixing below that level came on 1 October, at 1.1298.
Plan B, wait for a retest. Say you place a sell limit order at 1.1578, the broken swing, with the same stop. The stop is 74 pips away, and a 1:2 target would be 148 pips lower, at 1.1430. On the fixings price never came back to 1.1578, so this order never filled. Retest entries give a tighter stop, but they can miss the whole move.
Size from the stop. Say you are ready to lose USD 100 on the idea. On Plan A each pip may cost you no more than about USD 0.99, because 100 ÷ 101 = 0.99. On Plan B the limit is about USD 1.35 a pip (100 ÷ 74). The wider stop needs the smaller position. Add the spread to your stop distance, since you sell at the lower price and buy back at the higher one. In a fast break a stop can also fill at a worse price, which is called slippage.
Leverage magnifies the result both ways. In the UK, FCA rules for retail CFD clients “Limit leverage to between 30:1 and 2:1” (FCA, 2019), and ESMA rules set “30:1 for major currency pairs” in the EU. Whatever the ratio, the money lost at a 101-pip stop depends on your position size.
False shifts and how to filter them
Many breaks fail. Price closes through a swing and then makes a new high anyway. StockCharts gives the right attitude for trend-line breaks: “Trend line breaks should not be the final arbiter, but should serve merely as a warning that a change in trend may be imminent.” The same caution fits a swing break.
- A pullback that holds above the protected low leaves the trend intact.
- Judge closes, not wicks.
- Use the right swing. A minor swing on a five-minute chart is not the protected swing of a daily trend, so check one timeframe higher.
- Respect news. A data release can push price through a level and back within minutes.
- Do not trade every shift. Low timeframes print many of them, and acting on each one leads straight to overtrading.
Some smart-money teachers first wait for price to run an obvious high or low, which they call a liquidity sweep. We found no tested success rate for that. The rejection block is another zone from the same school of chart reading.
What the research does and does not show
We found no regulator report or peer-reviewed study that tests the market structure shift itself. The closest research covers why breaks can be fast and whether chart reading can be tested.
In a 2002 Federal Reserve Bank of New York staff report, C. L. Osler wrote: “I provide evidence that currency stop-loss orders contribute to rapid, self-reinforcing price movements” (Staff Report 150). If many stops sit beyond a swing, a break can set them off in a run. That does not show that a break predicts the next trend.
Lo, Mamaysky and Wang applied automatic pattern recognition to US stocks from 1962 to 1996 (NBER Working Paper 7613, March 2000). They found that “several technical indicators do provide incremental information and may have some practical value”. They also noted that chart shapes are “often in the eyes of the beholder”, which is the problem a written MSS rule tries to solve. Their sample was stocks, not currencies.
For currencies, Menkhoff and Taylor’s review in the Journal of Economic Literature (December 2007) found that technical analysis “is widespread in the foreign exchange market” and “may be profitable”. That market is large: the BIS reported FX trading of $9.5 trillion per day in April 2025. Keep the word “may” in mind when any guide calls a pattern reliable.
Practise reading shifts on a free Volity demo
The free demo is available on every Volity account tier. Use it to mark protected swings and log each shift: the date, the timeframe, the close through the swing, and what price did next. Your log shows how often your rule works.
Forex trades 24/5 on Volity. Gold, silver, US500, US100 and WTI are among a growing range of markets that trade 24/7 alongside crypto, so you can test the same read beyond currency pairs. The Markets account is commission-free, and spreads are dynamic, starting from 0.6 pip. The full cost schedule is on the Volity charges and fees page, and the execution policy explains how orders are handled.
When your log matches your rules, move to a live account. A Volity Markets account starts from $1, with funding from 10 EUR.
Before acting on any shift, name the protected swing, the candle that closed through it and the stop that proves you wrong. If one is missing, there is no trade yet.
Fact check: EUR/USD figures are ECB euro reference rates (14:10 CET fixings), read on 11 November 2026; swings, pip distances and the hypothetical plans are our own arithmetic from them. Trend-line rules from StockCharts ChartSchool. Research from the New York Fed (Osler, 2002), NBER (Lo, Mamaysky and Wang, 2000) and the Journal of Economic Literature (2007). FX turnover from the BIS Quarterly Review, December 2025. Retail leverage rules from the FCA (2019) and ESMA (2018). Volity details from volity.io, checked 11 November 2026.
Frequently asked questions
What is a market structure shift in simple terms?
It is the first candle close through the swing that was holding a trend. In an uptrend that is the last higher low, and in a downtrend the last lower high. It warns that the trend may be reversing.
Is a market structure shift the same as a change of character?
Not always. Some guides use change of character for the first sign of a turn and keep market structure shift for a confirmed break of the protected swing. Others treat them as one. Pick one definition and use it every time.
Which timeframe works best for a market structure shift?
We found no study that ranks timeframes for this. A common teaching is to read the trend on a higher timeframe, such as the daily chart, and time entries on a lower one. Whatever you choose, judge the close on the same timeframe each time.
Do you need displacement to confirm a shift?
Many teachers want a fast, large move through the swing, which they call displacement. It is a convention with no agreed size. A close through the protected swing is the core test, and displacement is extra context.
Can a market structure shift fail?
Yes. Price can close through the swing and then turn back to make a new high or low. That is why the stop goes beyond the last lower high or higher low, and why you size the trade from that stop.
Does a market structure shift work on gold and indices?
The read is the same on any chart with clear swings, including gold, silver and indices. On Volity, gold, silver, US500 and US100 trade 24/7. Test your rule on a demo, because we found no study of how often it works on any market.