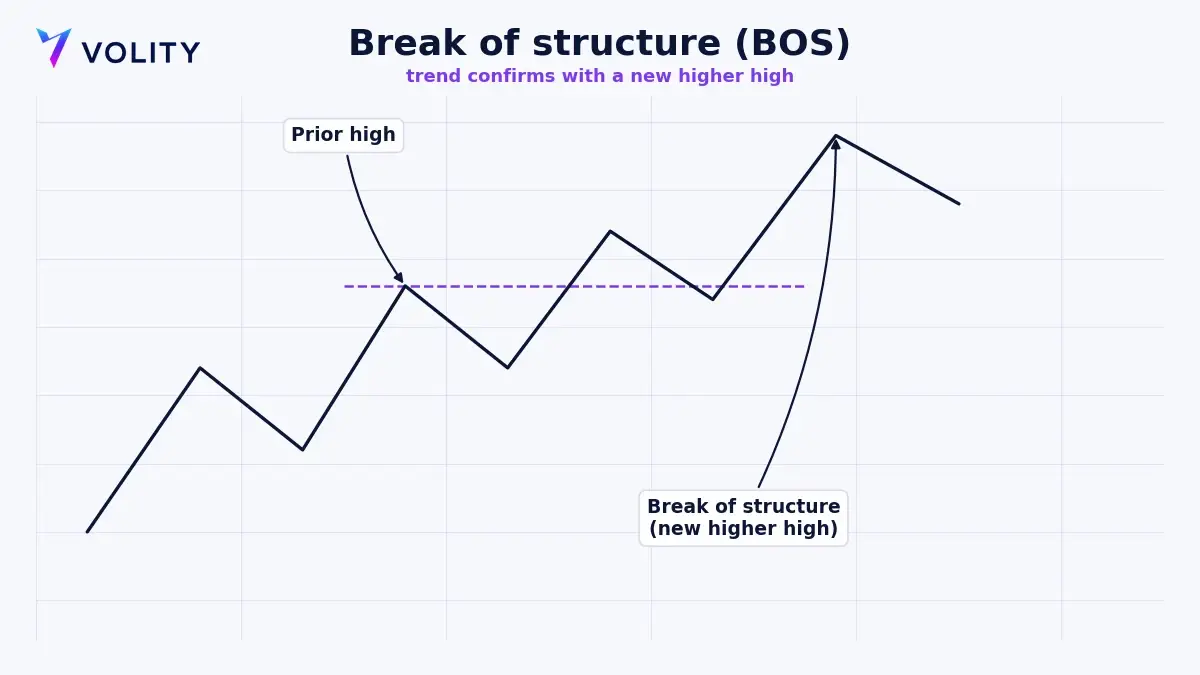
A break of structure, or BOS, is the moment price closes beyond a prior swing high or swing low and confirms that the current trend is still running. In an uptrend it prints a fresh higher high; in a downtrend, a fresh lower low. Because the break travels with the trend, a BOS is a continuation signal. A break that fires against the trend is a different event, a change of character, and that one hints at a reversal.
What is a break of structure in trading?
Market structure is the trail of swing points a market leaves behind. An uptrend prints higher highs and higher lows. A downtrend prints lower highs and lower lows. A break of structure happens when the market pushes past its most recent swing point in the direction of the trend and closes there, stretching the pattern one leg further.
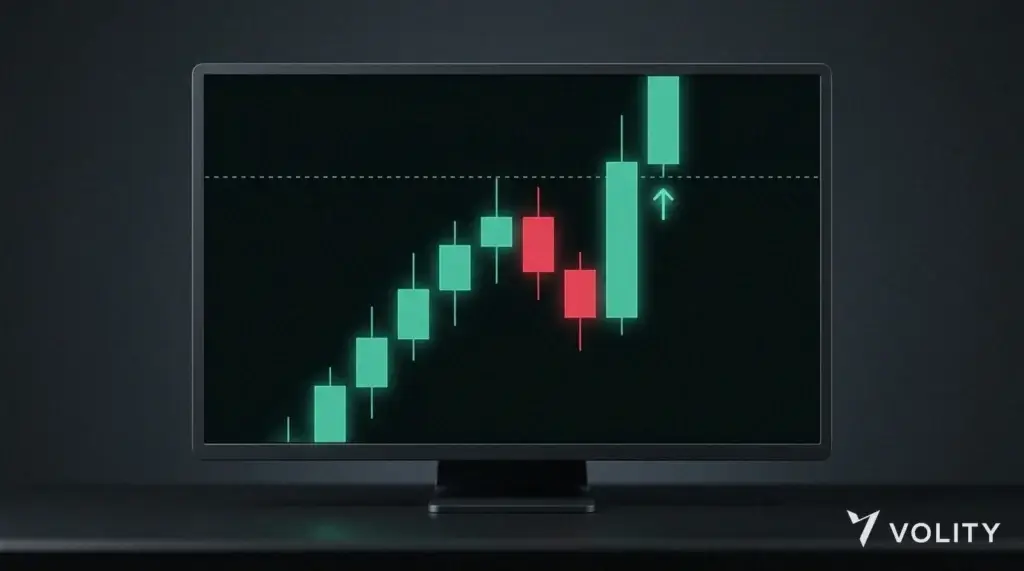
The word “close” carries the weight here. A swing high that gets poked by a wick and then holds does not count. More often that poke is a liquidity grab, hunting stops above the level before price falls back. A genuine BOS needs a candle body to close beyond the swing, ideally on a wide, one-directional move that smart money concepts label displacement. That decisive close is the market showing you the trend has fresh fuel behind it.
How do you identify a break of structure on a chart?
Work top down and keep it mechanical, the way sound technical analysis teaches. Structure that reads cleanly on the 4-hour or daily chart is worth far more than structure you have to squint at on the 1-minute.
- Mark the last two or three confirmed swing highs and swing lows. A swing high is a peak with lower highs on either side; a swing low is the mirror image.
- Read the current trend from those points. Higher highs with higher lows mean up; lower highs with lower lows mean down.
- Draw a line at the most recent swing high for an uptrend, or the most recent swing low for a downtrend. That line is your break level.
- Wait for a candle body to close beyond the line. The close confirms the break of structure, and a touch on its own does not.
- Judge whether the breaking move was impulsive. A wide, one-directional candle carries more weight than a slow drift over the line.
A clean BOS usually leaves a footprint you can trade. The last opposite-colour candle before the impulsive leg becomes an order block, and the displacement often leaves a fair value gap, an unfilled space between candles. Both give you entry zones to work on the pullback.
Break of structure vs change of character: what is the difference?
This is the distinction that trips up most beginners. A break of structure continues a trend. A change of character, also written as a market structure shift, is the first hint that a trend may be ending. The two look almost identical on the screen, yet they point opposite ways.
| Feature | Break of structure (BOS) | Change of character (CHoCH / MSS) |
| What it signals | Trend continuation | Possible trend reversal |
| Direction of the break | With the trend | Against the trend |
| In an uptrend | New higher high | Breaks the last higher low |
| Trader response | Look to join the trend | Prepare for a turn, stand aside or fade |
One rule keeps them straight. If the break extends the existing pattern, it is a BOS. If the break fires in the wrong direction and violates the trend’s last protected swing, it is a change of character. Our guide to the market structure shift covers the reversal side in full.
How do you trade a break of structure?
Break of structure trading pays best on the retracement that follows the break. Chasing the break candle itself, once it has already run wide, hands you the top of the move and a stop miles away. The edge sits in the pullback, where you get a better price and a tighter stop.
- Confirm the BOS with a body close rather than a wick.
- Mark the order block or fair value gap left inside the impulsive leg that caused the break.
- Wait for price to pull back into that zone instead of entering at the high of the move.
- Time the entry with a smaller-timeframe reaction, such as a lower-timeframe BOS in your direction.
- Place the stop beyond the swing that started the move, and set the target at the next structural level, a prior support or resistance zone, or a fixed risk-to-reward multiple.
The same routine works long or short on any liquid market, from a major forex pair (the most heavily traded market in the world) to an index CFD, gold, or a large-cap crypto. What changes is the volatility, and therefore the stop distance, not the logic. Pair a BOS entry with an order block or a fair value gap and you trade a repeatable plan instead of a hunch.
What do break of structure examples look like?
Two break of structure examples make the pattern concrete on the candlestick charts you actually trade.
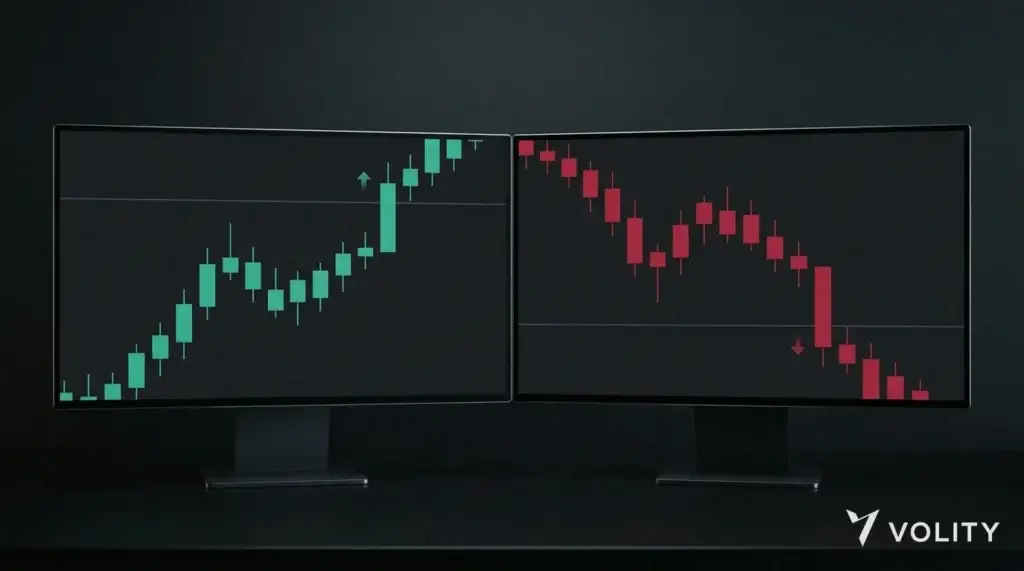
Start with a bullish continuation on EUR/USD. Price is trending up, printing higher highs and higher lows. It pulls back, dips into an order block, then fires a wide green candle that closes above the last swing high. That close is the BOS. A trader who marked the order block enters on the shallow retracement that follows, sets the stop below the swing low, and rides the next leg up.
Now flip it to a bearish continuation on an index CFD. The market is making lower highs and lower lows. It bounces, fills a fair value gap left by the last drop, then breaks the previous swing low on a strong red candle. The BOS confirms the downtrend has more to give, and the entry comes on the retest of that gap.
What are the most common break of structure mistakes?
- Counting wicks as breaks. A wick through a level with no body close is usually a stop raid, and price often reverses straight after.
- Marking every minor swing. Too many levels turn the chart into noise, so track the swings that stand out at a glance.
- Ignoring the higher timeframe. A 5-minute BOS that fights a strong daily trend is low quality, and the breaks that agree with the bigger picture hold up better.
- Chasing the breakout candle. Entering at the far end of an already-extended move leaves you a wide stop and poor reward.
- Confusing a BOS with a reversal. A break that travels against the trend is a change of character, and it calls for a different plan.
What is an internal versus external break of structure?
Traders often split the concept into two levels, and the split sharpens your entries. An external break of structure clears a major swing high or low, the kind that defines the larger trend on the higher timeframe. An internal break of structure works on a smaller scale, breaking a minor swing inside a pullback or a range before the external structure gives way.
The practical move is to combine them. Let the higher-timeframe external structure set the direction, then use an internal break of structure on a lower timeframe to time the entry after a retracement. A daily uptrend gives the external bias; a 15-minute internal BOS in the same direction, once price taps an order block, gives the trigger. When internal and external structure agree, the trade has both the trend and the timing behind it.
The trap is treating an internal break as an external one. A minor BOS inside a pullback confirms the smaller leg alone; the whole trend has not necessarily resumed. Keep the two scales separate, note which one any given break belongs to, and you stop mistaking noise for a genuine break of structure. This is also how a solid break of structure trading plan builds a repeatable, multi-timeframe routine rather than a reaction to every wiggle.
Putting break of structure to work on Volity
A break of structure only earns its keep if you can act on it cleanly. Volity lets you trade the same setup across forex, indices, commodities, and crypto from one account through CFD trading, so a BOS you spot on EUR/USD and one you spot on gold run through the same charts and the same risk tools. Leverage of up to 1:500 on forex lets you size a position to your planned stop rather than your balance, and the charts on the Volity platform mark swing structure the way this guide describes.
Leverage cuts both ways, and a break that fails can move against you as fast as a good one runs. Regulators including the FCA and ESMA restrict how leveraged CFDs are sold to retail traders for that reason, so cap the risk on each trade and let negative balance protection backstop the rest. Practise the read on a Volity demo before you commit real funds, and check the spread and swap for your instrument on the charges and fees page so the cost of holding a position is part of the plan.
Break of structure FAQ
Is a break of structure bullish or bearish?
Either one, depending on the trend. In an uptrend a BOS is bullish, because it prints a new higher high and confirms the trend continues. In a downtrend a BOS is bearish, because it prints a new lower low. A break of structure always agrees with the existing trend, and a break against the trend is a change of character instead.
What timeframe is best for spotting a break of structure?
The 4-hour and daily charts give the cleanest structure and the fewest false signals. Many traders read the trend on the higher timeframe, then drop to the 15-minute or 5-minute to time an entry once a break of structure appears. Lower timeframes on their own throw up more noise and more failed breaks.
Does a break of structure need a candle close?
Yes. A reliable break of structure needs a candle body to close beyond the prior swing point. A wick that pierces the level and pulls back is not confirmation, and it often marks a liquidity grab where stops were taken before price turned. Waiting for the close filters out most of those traps.
What is the difference between BOS and a breakout?
A classic breakout is price leaving a range or clearing a horizontal support or resistance line. A break of structure is more specific: price closing past the last swing high or low inside an established trend, which confirms continuation. A BOS is one particular kind of breakout, the break of the last swing point within a trend. A breakout that happens in open space, with no trend structure around it, stays just a breakout.