The hammer candlestick pattern is a reversal signal, not a guarantee. In 2026 high-volatility markets, algorithmic “liquidity hunts” deliberately break below hammer lows to trigger retail stop-losses before reversing, creating false signals. A hammer taken on its own is close to a coin flip, and many traders enter and exit on consecutive candles at a loss. Leverage amplifies these losses during gap opens or major news events that override technical patterns completely. Capital at risk in all leveraged trading.
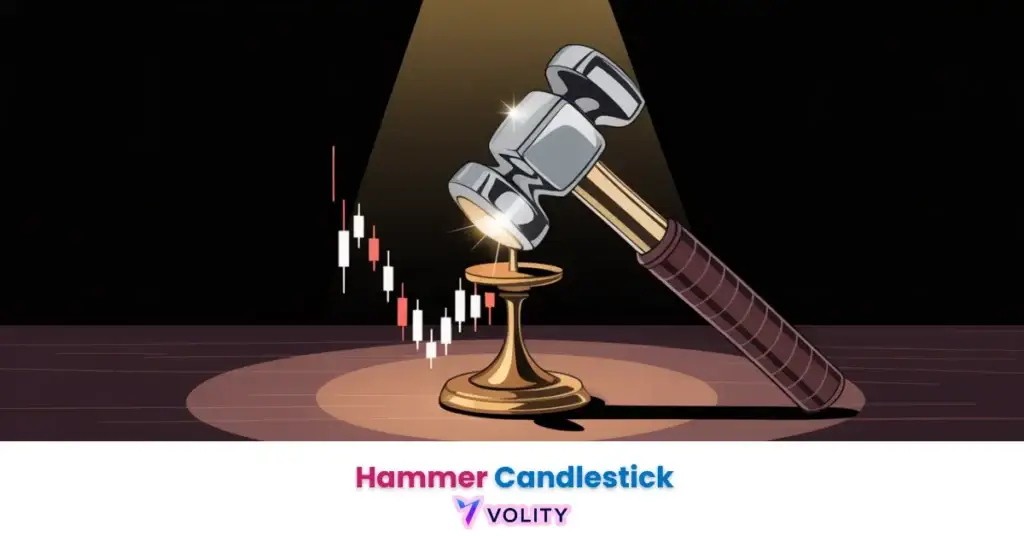
The hammer candlestick is a bullish reversal pattern that forms at the base of a downtrend, characterized by a small real body and a long lower shadow. It signals that sellers drove prices aggressively lower before being completely rejected by buyers by the session close. In 2026, its reliability is significantly enhanced when it forms at established support levels and is validated by a bullish confirmation candle, making it a cornerstone tool for bottom-fishing strategies.
Hammer candlestick patterns function as a visual representation of a market “v-bottom” condensed into a single price bar. This pattern identifies the moment when selling pressure is completely absorbed by institutional buying interest, signaling a potential shift in trend direction. It serves as a primary tool for traders seeking to enter long positions at the earliest stages of a new uptrend.
The 2026 trading landscape is characterized by algorithmic “stop-runs” which often create hammer-like wicks that test the resolve of retail participants. By utilizing strict confirmation rules, market participants can distinguish between minor price bounces and sustainable structural reversals in global asset classes.
While understanding Hammer Candlestick Pattern is important, applying that knowledge is where the real growth happens. Create Your Free Forex Trading Account to practice with a free demo account and put your strategy to the test.
What is a hammer candlestick pattern and how do you identify it?
A hammer candlestick is a bullish reversal pattern that identifies a market bottom through its small real body and a long lower shadow that rejects lower price levels.
The visual structure of a hammer contains three core elements. The body sits at the top of the trading range and is small relative to the candle as a whole. The lower shadow extends downward significantly, often reaching 2-3 times the length of the body. The upper shadow is minimal or absent, indicating that buyers successfully pushed prices back up after the initial selling panic.
Market psychology reveals why this pattern signals a reversal. Early in the session, sellers drive prices aggressively downward, creating the lower wick. This selling pressure tests the conviction of buyers. However, the market finds a “floor” where institutional buyers recognize value and absorb the selling. By session close, buyers have regained control completely, pushing the close back near the open. The result is a candlestick that visually represents the entire reversal dynamic in one bar.
Preceding trend context is mandatory for valid hammer identification. A hammer only signals a bullish reversal if it forms after a clear downtrend. A hammer appearing in a sideways market or after just one down candle lacks the conviction necessary for a high-probability trade. Professional traders require at least 2-5 down candles before they recognize a new hammer as a true reversal signal.
The hammer is among the most widely recognised single-candle patterns, which matters in itself: a pattern that many participants are watching becomes a level many participants act on. Wikipedia’s candlestick pattern article covers the family it belongs to.
The Anatomy of a High-Conviction Hammer
A high-conviction hammer is identified by a lower shadow that is at least 2.5 times the length of the body, signaling extreme price rejection.
The “Shadow-to-Body” ratio serves as a quality filter. A hammer with a 3:1 shadow-to-body ratio is significantly stronger than one with a 1.5:1 ratio. The larger the shadow relative to the body, the more aggressively sellers were rejected. A hammer where the lower shadow is 5+ times the body’s length represents extreme desperation selling that was absorbed, a pattern of exceptionally high conviction.
The absence of an upper wick increases the signal’s strength substantially. When sellers tried to drive lower but found no follow-through at lower prices, they capitulated completely by close. A hammer with no upper wick (or only a 1-2 pip upper wick) indicates buyers were so dominant that they allowed no selling pressure to develop on the upside during the reversal move.
Ready to Elevate Your Trading?
You have the information. Now, get the platform. Join thousands of successful traders who use Volity for its powerful tools, fast execution, and dedicated support.
Create Your Account in Under 3 MinutesHow reliable is the hammer candlestick in 2026?
The reliability of a hammer candlestick identifies its statistical win rate based on historical backtesting across different timeframes and asset classes.
Thomas Bulkowski’s tested figures are the most useful published benchmark. His testing finds the hammer acts as a bullish reversal 60% of the time, which ranks it 26th for reversal reliability but only 65th of 103 candle types for the size of the move that follows. In other words the direction call is respectable and the follow-through is not, which is exactly why a confirmation candle matters: requiring the next bar to close above the hammer’s high filters out the reversals that go nowhere.
Timeframe selection dramatically impacts reliability. Daily (D1) and 4-hour (H4) charts remain the “Gold Standard” for hammer signals. On these timeframes, a hammer represents a substantial consolidation pattern that often precedes meaningful moves. 1-hour and 15-minute charts produce excessive false signals due to intraday noise and algorithmic volatility. Professional traders focus exclusively on daily and 4-hour hammers, understanding that timeframe matters as much as the pattern itself.
Asset class matters, though not in a way anyone has published a reliable number for. A hammer at a round-number support level in a metal behaves differently from one in a single stock, where an earnings release or a guidance change can override the chart entirely. Judge the level first and the candle second.
How do you confirm a hammer signal for 2026 execution?
Signal confirmation identifies the secondary technical filters required to validate a hammer pattern before entering a long position.
The confirmation candle is the next price bar immediately after the hammer. For a valid bullish reversal signal, this candle must close above the hammer’s high. Closing below or even at the hammer’s high invalidates the signal. Many retail traders enter prematurely on the hammer itself, only to exit at a loss when the confirmation candle fails to appear. Patience waiting for the confirmation candle is the difference between successful hammer trading and stop-loss accumulation.
Volume verification adds institutional conviction to the setup. A hammer accompanied by a clear expansion in volume during the formation points to real participation behind the rejection of lower prices. Volume expansion on the confirmation candle points the same way, that demand drove the reversal rather than a thin bounce. Professional traders scrutinize volume before entering; thin-volume hammers often fail spectacularly.
Indicator confluence uses RSI or moving average levels to back the trade. An RSI reading below 30 (oversold) during the hammer formation signals extreme selling exhaustion. A bounce off the 200-period exponential moving average adds confluence, buyers recognize the EMA as support and defend it aggressively. A hammer that forms while RSI is oversold and price is holding a major moving average is a far better proposition than a hammer in open space, because three independent reads are pointing the same way.
Worked illustration: on the 4-hour EUR/USD chart a hammer forms at a round-number support that has held before, with a lower shadow around two and a half times the body and RSI below 30. The signal is not tradable until the following bar closes above the hammer’s high. Entry goes on that close, the stop goes below the hammer’s low with enough clearance to survive a wick, and the first target is the previous swing high. The prices are yours to read off the chart; this is the sequence, not a record of a trade. Past performance is not indicative of future results.
Hammer vs. Hanging Man: Visual Similarities and Opposite Signals
The distinction between a hammer and a hanging man identifies the importance of trend context in determining whether the signal is bullish or bearish.
| Pattern Type | Visual Shape | Trend Context | Bulkowski tested result | What his testing found |
| Hammer | Long Lower Wick | Downtrend | Bullish reversal 60% of the time | Reversal rank 26; performance rank 65 of 103 |
| Hanging Man | Long Lower Wick | Uptrend | Bullish continuation 59% of the time | Theory says bearish reversal; testing says otherwise |
| Inverted Hammer (tested) | Long Upper Wick | Downtrend | Bearish continuation 65% of the time | Performance rank 6 of 103, the strongest move of the five |
| Shooting Star | Long Upper Wick | Uptrend | Bearish reversal 59% of the time | Near random on direction |
| Dragonfly Doji | T-Shape (No Body) | Downtrend | Reversal 50% of the time | Performance rank 98 of 103; indecision, not a signal |
Source: Thomas Bulkowski, thepatternsite.com. Each figure is the tested result published on that pattern’s own page, linked above.
The hammer and hanging man are visually identical. Both feature a small body and a long lower shadow. However, trend context determines their meaning completely. A hammer appears at the bottom of a downtrend and reverses 60% of the time in Bulkowski’s testing. The hanging man appears at the top of an uptrend and is supposed to warn of a reversal, but his data has it acting as a bullish continuation 59% of the time, which is the opposite of what the textbook says.
The reason for this context-dependent reliability is psychological. A hammer at the bottom of a downtrend represents buyers stepping in after sellers have exhausted their selling power. This reversal has momentum because it fundamentally shifts sentiment from bearish to bullish. A hanging man at the top of an uptrend merely suggests that intraday sellers tested the uptrend; it does not guarantee they’ll continue selling on the next candle. Uptrends have established buying support, making single-candle bearish signals weaker.
Traders who confuse these patterns often enter short positions on hanging men expecting reversals, only to find that the uptrend resumes after one candle of hesitation. The error is expensive precisely because trend context was ignored. Professional traders verify the preceding trend explicitly, counting down candles before a hammer, counting up candles before labeling a hanging man.
Trading Strategies: Entry, Stop-Loss, and Take-Profit
Trade management identifies the precise price levels for entering a long position and protecting capital during a hammer reversal.
The “Aggressive” entry executes a market order at the close of the confirmation candle. This approach captures the move immediately but risks being caught if the candle’s close is a false high. The “Conservative” entry uses a limit order at the 50% retracement of the hammer’s lower shadow, if the hammer low was 1.0470 and the hammer high was 1.0540, the 50% retracement is 1.0505. Waiting for a pullback to this level reduces entry price but sacrifices some of the initial momentum if the market accelerates immediately.
Stop-loss placement: put the stop below the hammer’s low with clearance, not exactly at it. On a major FX pair around ten pips is a workable starting point, so a hammer low of 1.0470 gives a stop near 1.0460, but the clearance should scale with the instrument’s own volatility. This placement provides enough cushion to avoid algorithmic “wick-hunts” that deliberately spike below technical levels to trigger retail stops. A stop placed exactly at the low (1.0470) is vulnerable to being taken out by the very price action that defines algorithmic trading in modern markets.
Scaling Out uses two approaches. The conservative method closes the entire position at the previous swing high, if the hammer was at support after a downtrend that bottomed at 1.0500, and the previous swing high was 1.0620, the target is 1.0620. The aggressive method uses a 1:2 risk-to-reward ratio. If risking 40 pips (stop 10 pips below the low, entry at +30 from low), the profit target is 80 pips above the entry.
Turn Knowledge into Profit
You have done the reading, now it is time to act. The best way to learn is by doing. Open a free, no-risk demo account and practice your strategy with virtual funds today.
Open a Free Demo AccountWhy do hammer patterns fail in high-volatility markets?
Pattern failure identification reveals the impact of algorithmic volatility and news-driven events on the reliability of single-candle signals.
Algorithmic Stop-Runs represent the #1 failure mechanism in 2026 markets. High-frequency traders map out visible technical levels, especially support and resistance, and deploy algorithms to trigger retail stop-losses clustered below those levels. When a hammer forms and stops are visible at the low, HFT algorithms spike price below the low just enough to trigger liquidations, then reverse sharply. The hammer’s intended reversal is negated by algorithmic manipulation. Professional traders respond by placing stops further away (10+ pips) rather than tight stops that are easy targets.
Fundamental Overrides crush hammer signals when major economic events occur. A hammer at support might appear ready to reverse, but if the Federal Reserve unexpectedly raises interest rates or a central bank chairman warns of tightening, the fundamental backdrop overwhelms the technical signal. Price gaps through the hammer low and continues falling for days. No technical pattern can compete with fundamental regime shifts.
Timeframe mismatches create failures when traders identify hammers on intraday charts without confirming them on higher timeframes. A hammer on a 1-hour chart might appear valid, but if the 4-hour chart is in a strong downtrend with no signs of reversal, the intraday hammer is just noise, not a structural reversal. Successful hammer traders validate their signals across multiple timeframes before entering.
Key Takeaways
- Hammer candlestick patterns are primary bullish reversal signals that identify the rejection of lower prices at market bottoms.
- Bulkowski’s tested figure has the hammer reversing 60% of the time, with a below-average move after it, which is why confirmation matters.
- Trend context is the most critical factor, as the visual shape of a hammer in an uptrend identifies a bearish “Hanging Man” instead.
- Place the stop below the hammer’s low with enough clearance to survive a wick, rather than exactly at the low where stops cluster.
- A green hammer closes above its open, which reads as a slightly stronger signal than a red one, though no published test isolates the difference.
- Timeframe selection favors the Daily and 4-hour charts, where the hammer signal is less prone to the noise found on intraday timeframes.
Frequently Asked Questions
This article contains references to the hammer candlestick pattern and Volity, a regulated CFD trading platform. This content is produced for educational purposes only and does not constitute financial advice or a recommendation to execute any specific trading strategy using hammer patterns. Candlestick patterns vary in reliability based on timeframe, asset class, and market conditions; always verify your broker’s trading rules and risk management policies before trading. Some links in this article may be affiliate links.