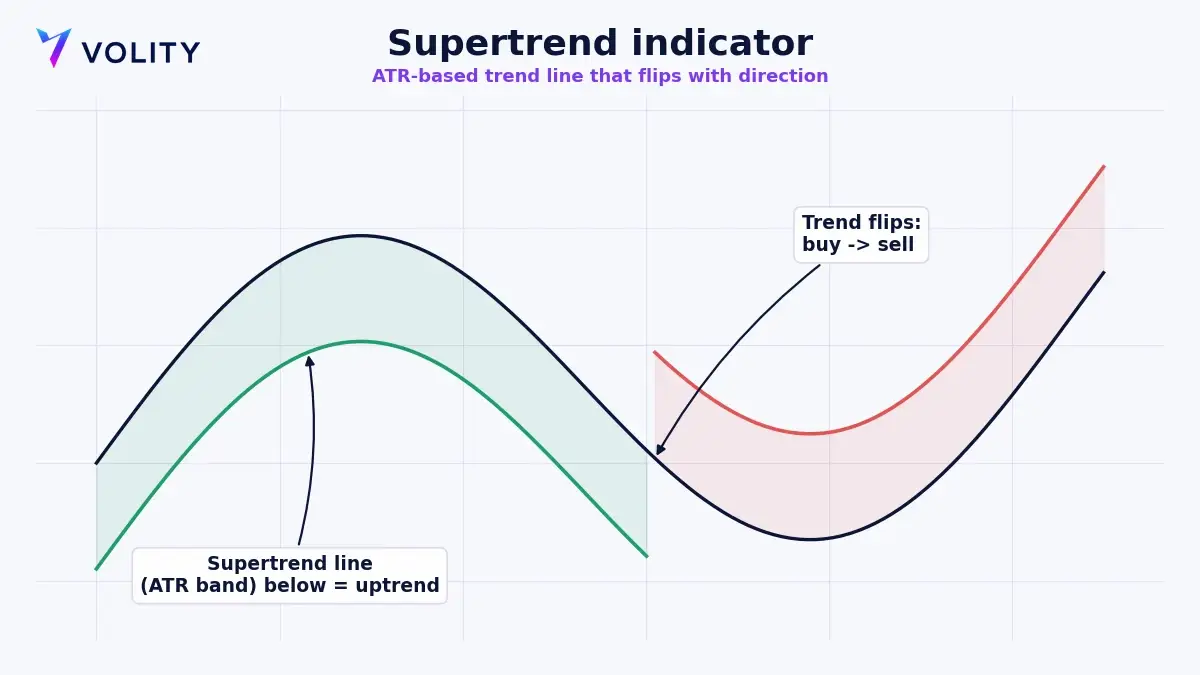
The Supertrend indicator is a trend-following tool that plots a single line above or below price to show which way a market is heading. It is built from the Average True Range, so it adapts to volatility instead of sitting a fixed distance from price. When price closes above the line the trend is up and the line becomes a trailing stop underneath; when price closes below it, the trend flips down and the line jumps above.
What is the Supertrend indicator?
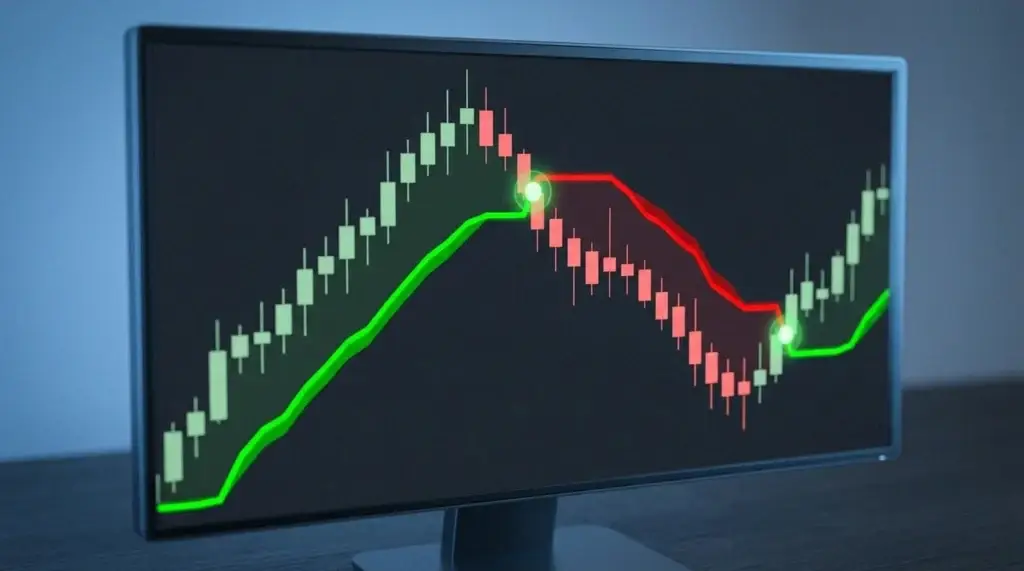
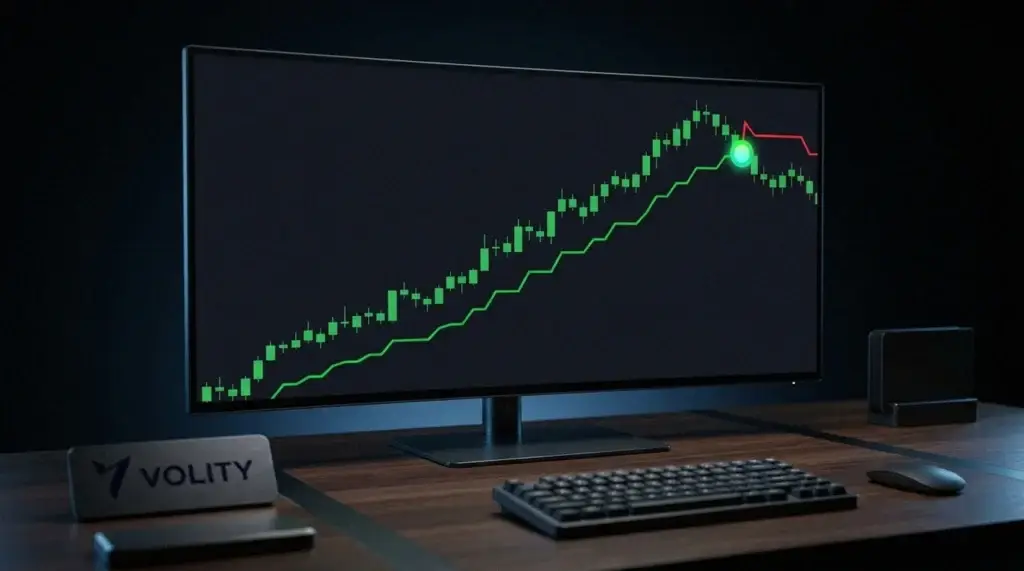
The Supertrend is a price overlay, which means it sits directly on the candlesticks rather than in a separate window below the chart. It draws one line that follows the trend: below price in an uptrend and above price in a downtrend. Most charting packages colour it green when the trend is up and red when it is down, so you can read direction at a glance.
What makes it more than a coloured moving average is the engine underneath. The Supertrend is calculated from the Average True Range, the standard measure of how far an instrument typically travels in a session. Because the line sits a multiple of ATR away from price, it widens in volatile conditions and tightens in calm ones. That is why many traders reach for it rather than a fixed-distance stop that ignores how the market is actually moving.
How is the Supertrend calculated?
You never have to compute it by hand, but knowing the inputs helps you use it well. The Supertrend takes the midpoint of each bar, the average of the high and the low, then adds and subtracts a multiple of the ATR to form an upper band and a lower band. The line you see switches between those two bands depending on where price closes.
Two settings drive everything: the ATR period and the multiplier. The common defaults are a period of 10 and a multiplier of 3. Shorten the period or shrink the multiplier and the indicator turns more sensitive, flipping sooner and catching turns early, at the cost of more false signals. Lengthen the period or raise the multiplier and it turns slower and steadier, filtering out noise but confirming later. The right pair depends on the instrument and the timeframe you trade, which is worth testing rather than assuming.
| Setting | Lower value | Higher value |
| ATR period | More sensitive, earlier flips | Smoother, fewer flips |
| Multiplier | Tighter line, more signals | Wider line, fewer whipsaws |
What are the Supertrend buy and sell signals?
The core signal is the flip. When price closes above the Supertrend line and it switches from red to green, that is a buy signal and the start of a tracked uptrend. When price closes below the line and it switches from green to red, that is a sell signal. Because the trigger is a simple colour change, it is easy to spot on a chart and easy to code into an alert.
- A buy signal is a close above the line, where the colour turns green and the trend flips up.
- A sell signal is a close below the line, where the colour turns red and the trend flips down.
- As a trailing stop, the line itself becomes your exit once you are in a trade, ratcheting along behind price as the move runs.
That third use is where the Supertrend does its most useful work. Plenty of traders take their own entry and then lean on the Supertrend line as a trailing stop, holding the position until price finally closes through it. It lets a winner keep running while the exit moves up step by step behind it.
What are the limits of the Supertrend indicator?
The Supertrend works best in a trend and struggles in a range. When a market drifts sideways between support and resistance, price crosses the line again and again and the indicator whipsaws, firing a run of small losing signals in both directions. This is its single biggest weakness, and it comes with the territory for every trend-following tool, so it is worth planning around rather than wishing away.
The answer is context. Only take Supertrend signals when a market is clearly trending, and add a filter that tells you whether a trend is even there, such as a longer moving average or a momentum reading. Some traders run the Supertrend on two timeframes and trade only in the direction the higher one points. Treat it as one input in a plan, not a full system on its own.
How do you use the Supertrend in a strategy?
A simple, sturdy approach pairs the Supertrend with a trend filter and firm risk rules. It keeps you trading with the larger move and out of the worst of the chop.
- Set a trend filter first. A longer moving average, such as the 200 period, defines the dominant direction, and you only take Supertrend signals that agree with it.
- Enter on the flip that lines up with the filter, buying when the Supertrend turns green above it and selling when it turns red below.
- Place your initial stop at the Supertrend line and let it trail from there.
- Size the position against that stop. Because the ATR sets how far the line sits from price, your risk on the trade is defined the moment you enter.
- Exit on the opposite flip, or bank part of the position at a structure level and let the Supertrend trail the rest.
Using the Supertrend on Volity
An indicator is only as good as the platform that draws it and the speed that fills your order. The Volity MT platform and its TradingView-powered charts carry the Supertrend and the ATR it is built on, so you can drop it on any market, tune the period and multiplier, and trade the flip straight from the chart. TradingView publishes the full Supertrend documentation if you want to see how its version is drawn.
Because the Supertrend reads the same on any market, you can run it on forex, indices, gold and crypto, trading each as a contract for difference so you can go long or short. Leverage runs up to 1:500 on selected forex pairs, 1:100 on commodities and 1:50 on crypto, all regulated by CySEC through UBK Markets under licence 186/12. Rehearse your settings on a free demo until the flips and trailing stops feel routine, then trade live.
Leverage magnifies losses as much as gains, so treat the Supertrend as a way to place better trades, not bigger ones. Because leveraged CFDs carry real risk for retail traders, regulators including the FCA and ESMA restrict how they are sold and marketed to retail clients. Cap the risk on every position with a stop, check what a trade will cost against the published charges and fees before you fund, and keep position sizes small while you learn.
Related patterns
Frequently asked questions
What are the best Supertrend settings?
The common defaults are an ATR period of 10 and a multiplier of 3. There is no single best setting: lower values catch turns earlier but whipsaw more, and higher values are steadier but slower to confirm. Match them to the instrument and the timeframe you trade, and test a few combinations before you commit.
Is the Supertrend indicator good for day trading?
It can be, as long as the market is trending. Day traders often run it on a lower timeframe with a higher-timeframe filter to sidestep the whipsaws that hit quiet, ranging sessions. In choppy conditions it struggles, so pair it with a trend filter rather than acting on every flip.
Can the Supertrend be used as a stop loss?
Yes, and it is one of the indicator’s best uses. The line works as a volatility-based trailing stop: once you are in a trade, keep your stop at the Supertrend line and let it ratchet along behind price, closing the position when price finally breaks through it.
What is the difference between the Supertrend and a moving average?
The Supertrend and a moving average both ride on the chart, but they answer different questions in your technical analysis. A moving average smooths past prices into a mean; the Supertrend sets its line a multiple of the ATR away from price, so it reacts to volatility and hands you a clear green-or-red read on the trend. It behaves more like a dynamic trailing stop than a smoothing line.