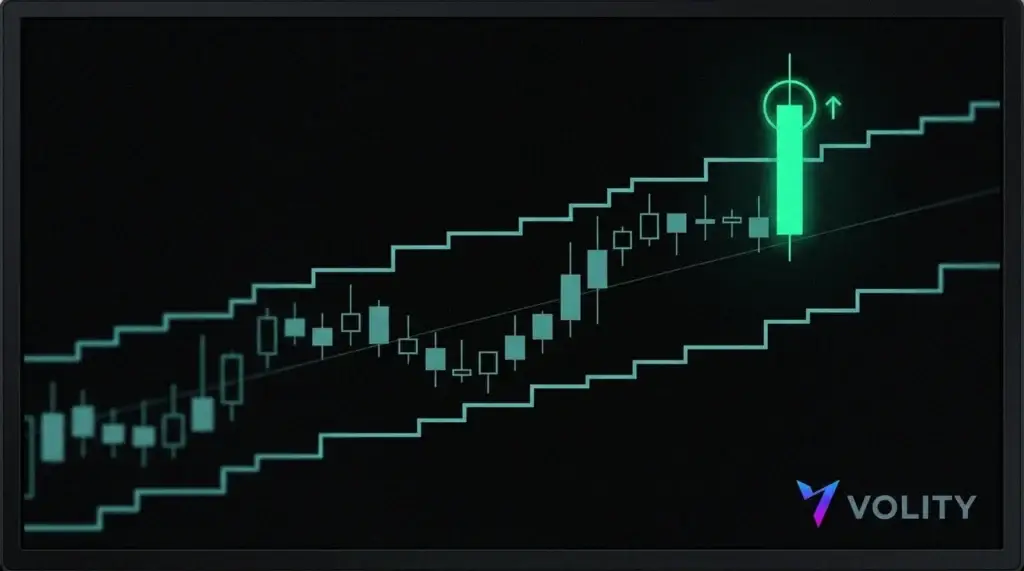
A Donchian channel plots three lines: the highest high and the lowest low over a set number of bars, and the average of the two in the middle. A close above the upper band is a bullish breakout to a new period high, and a close below the lower band is a bearish one. It is about the simplest breakout tool you can put on a chart.
What is a Donchian channel?
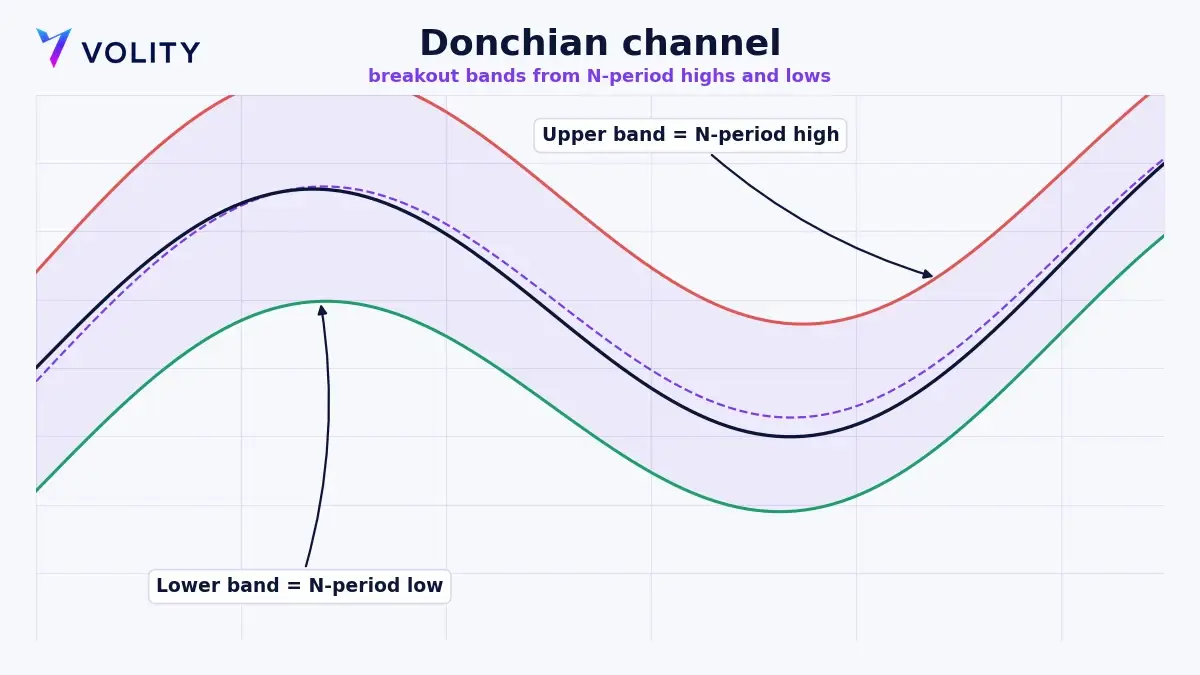
The Donchian channel was developed by Richard Donchian, one of the early names in trend following. It is one of the oldest technical indicators still in daily use, and it is built straight from price with no formula behind it. The upper band is the highest high over the last N bars, the lower band is the lowest low over the same window, and the middle band sits at the midpoint of the two. As fresh highs and lows print, the bands step up or down to follow.
Because the channel is drawn from real highs and lows, it maps support and resistance about as literally as an indicator can. Touch the upper band and price is trading at the top of its recent range; touch the lower band and it is at the bottom. A move beyond either line means price has done something it has not managed anywhere in the lookback window, and that is the one thing a breakout trader most wants to see.
What are the best Donchian channel settings?
The single input is the lookback period, the number of bars used to find the highest high and the lowest low. The classic default is 20, which on a daily chart is roughly a month of trading. Shorter periods pull the bands in tight and fire more signals; longer periods hold them wide and slow, so they screen out the minor moves. The Donchian channel belongs to the broader family of price channels, so if you have used one before the logic will feel familiar.
| Lookback period | Behaviour | Typical use |
| 10 to 15 bars | Tight, reactive, more signals | Shorter-term breakouts and exits |
| 20 bars | Balanced, the classic default | Standard breakout entries |
| 50 or more bars | Wide, slow, fewer signals | Major trend breakouts only |
A well-known refinement runs two channels at once, a longer one for entries and a shorter one for exits. You enter on a 20-bar breakout and then leave when price closes back through a 10-bar channel in the opposite direction. Pairing entry and exit this way keeps you in the strong trends while it walks you out of the losers quickly, and it is the skeleton of one of the most famous systems trend followers ever ran.
How did the Turtle Traders use the Donchian channel?
The Donchian channel sits at the heart of the Turtle Traders story. In the 1980s the traders Richard Dennis and William Eckhardt recruited a group of novices, nicknamed the Turtles, and handed them a rules-based trend-following system to run. One of the core entry rules was to buy when price broke above the 20-day high and sell short when it broke below the 20-day low, which is a Donchian channel breakout under a different name.
The Turtles bolted those entries onto strict position sizing based on volatility and clear exits through a shorter channel. Several of the novices went on to post large returns, which is why the experiment became a case study for anyone who studies technical trading systems today, and Curtis Faith later wrote it up in his book “Way of the Turtle”. The takeaway for a trader now has little to do with the exact numbers the Turtles used. What carries over is the structure. You need a breakout level to get you in and a level that tells you the idea has failed. The gap between the two sets how big the position can be, and you settle all of it before you enter.
How do you trade a Donchian channel breakout?
The method is mechanical, which is a large part of the appeal. Once the rules are set there is very little left to interpret.
- Pick two periods to work with. A 20-bar channel to find entries and a 10-bar channel to manage exits is a solid place to start.
- Take the signal on the close, not the wick. Go long when a bar closes above the upper band and short when a bar closes below the lower band.
- Let the mid-line or the shorter channel be your stop. A close back through the middle band, or through the 10-bar exit channel, takes you out of the trade.
- Size the position to the stop distance. Risk a small, fixed slice of the account on each trade, worked out from how far away the exit sits.
- Give the winners room. Trend systems earn their keep on the few trades that run a long way, so try not to bank profit too soon.
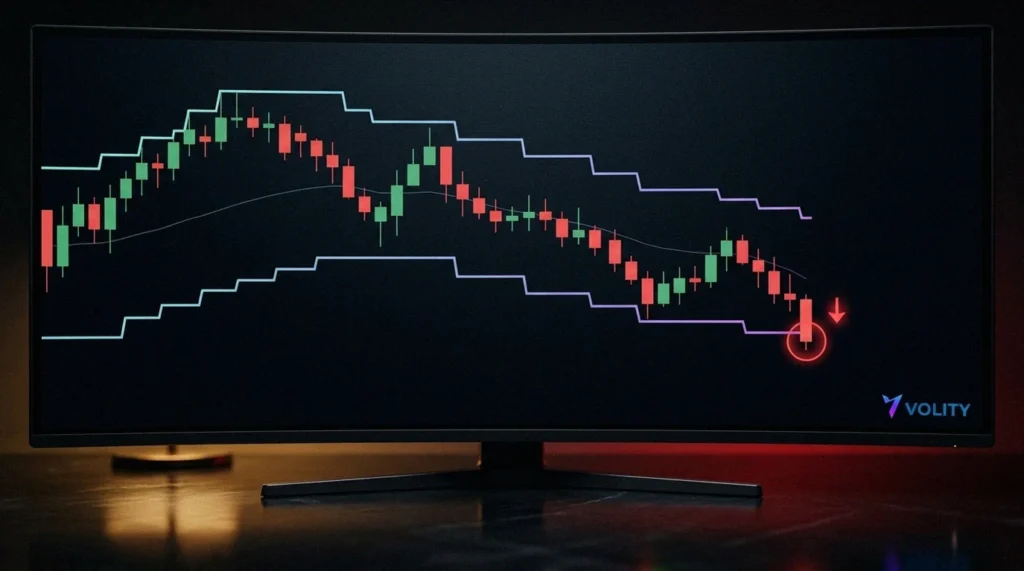
The soft spot in any breakout system is the false break, where price pokes past a band and then snaps straight back. It shows up most in quiet, sideways markets, so plenty of traders add a trend filter or only take breakouts that go with the higher-timeframe trend. Accept that false breaks come with the territory and let the trends that do run pay for them.
Donchian channel vs Bollinger Bands: what is the difference?
The two get mixed up because both draw a band around price, yet they measure different things. A Donchian channel uses the highest high and the lowest low, so its bands sit exactly on recent price extremes. Bollinger Bands take a moving average and add or subtract a number of standard deviations, so they widen and narrow with statistical volatility rather than with raw highs and lows.
In practice the Donchian channel is the purer breakout tool, since touching a band means a genuine new high or low. Bollinger Bands and the related Keltner channel tend to get used for volatility and mean-reversion work instead. Both earn their place; the Donchian channel is the one you reach for when the question is whether price has broken out to a new range extreme.
Trading breakouts on Volity
A breakout system needs quick, dependable execution, because getting in late at a fresh high eats straight into the edge. The Volity MT platform carries the Donchian channel and the drawing tools to map recent highs and lows, and it lets you trade breakouts as contracts for difference across the markets Volity covers, including forex, indices, gold and crypto, straight from the chart.
Because breakout trading lives or dies on risk control, fix the exit before you enter and size the position to it. Volity offers leverage up to 1:500 (product-dependent), so treat that as a tool to use deliberately rather than a number to max out. CFDs are leveraged products that carry a high risk of loss, and Volity offers them under CySEC licence 186/12 held via UBK Markets. You can open an account for $0, practise the settings on a demo, invest from $1 and start trading from $1, which gives you room to test your lookback periods until the signals read consistently before you commit real size. The full trading costs are set out separately so you can factor them in from the start.
Related patterns
Frequently asked questions
What does a Donchian channel show?
A Donchian channel shows the highest high and the lowest low over a set number of bars, with a mid-line halfway between them. It maps the recent trading range, so a close beyond either band marks a breakout to a new period high or low.
What is the default Donchian channel period?
The classic default is 20 bars, which on a daily chart works out to roughly a month of trading. Shorter periods give more frequent and tighter signals, while longer periods filter for major trend breakouts only.
Is the Donchian channel good for trend trading?
Yes. It is a classic trend-following and breakout tool, made famous by the Turtle Traders. It works best when a market is trending and struggles in a range, so many traders pair it with a trend filter to sidestep false breakouts.
What is the difference between a Donchian channel and Bollinger Bands?
A Donchian channel is built from the highest high and lowest low, so its bands sit on real price extremes. Bollinger Bands use a moving average and standard deviation, expanding and contracting with volatility, which makes them better suited to mean-reversion trading.