The market facilitation index (MFI) is a Bill Williams indicator that measures how far price moves for each unit of volume traded. The formula is the bar’s range divided by its volume. Paired with the change in volume, it sorts every bar into four types that show whether a move has real backing behind it.
What is the market facilitation index?
The market facilitation index was introduced by Bill Williams in his book Trading Chaos. It answers one question: how efficiently is volume moving price? When plenty of volume produces a wide price range, the market is facilitating movement well. When heavy volume barely nudges price, something is blocking the move, and that stall often matters more than the move itself.
The indicator sits in a different family from momentum tools. It does not flag overbought or oversold levels the way an oscillator does; instead it reads whether the effort behind a bar, the volume, is converting into a result, the price range. That effort-versus-result read is why Williams treated the MFI as a kind of lie detector for price moves, and why it works best next to his other tools rather than alone.
How is the market facilitation index calculated?
The calculation is the simplest of any indicator in this cluster:
Market facilitation index = (High – Low) / Volume
Take the bar’s high, subtract the low to get the range, and divide by the bar’s volume. A higher value means price travelled a long way on relatively little volume; a lower value means price moved little despite the volume traded. The raw figure is plotted as a histogram beneath price.
The number on its own is rarely the point. What Williams cared about is the direction of change from one bar to the next, in both the market facilitation index and volume together. Is the MFI rising or falling? Is volume rising or falling? Those two questions, each with two answers, create the four bar types that make the indicator useful.
What do the four MFI bars mean?
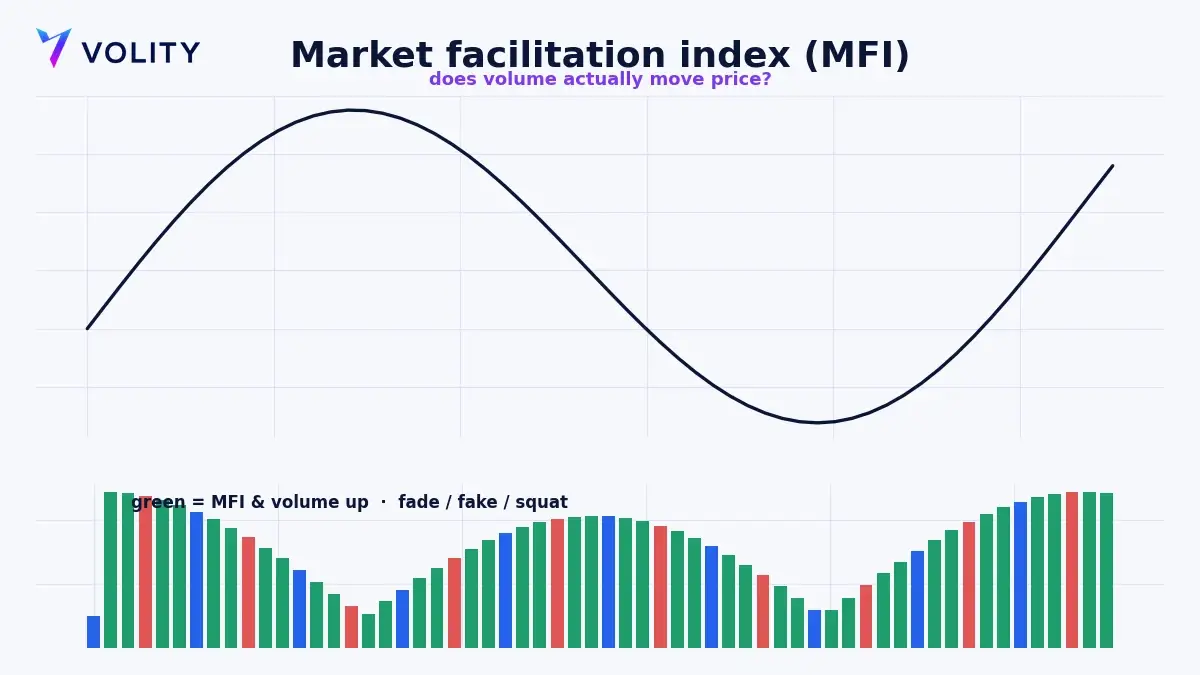
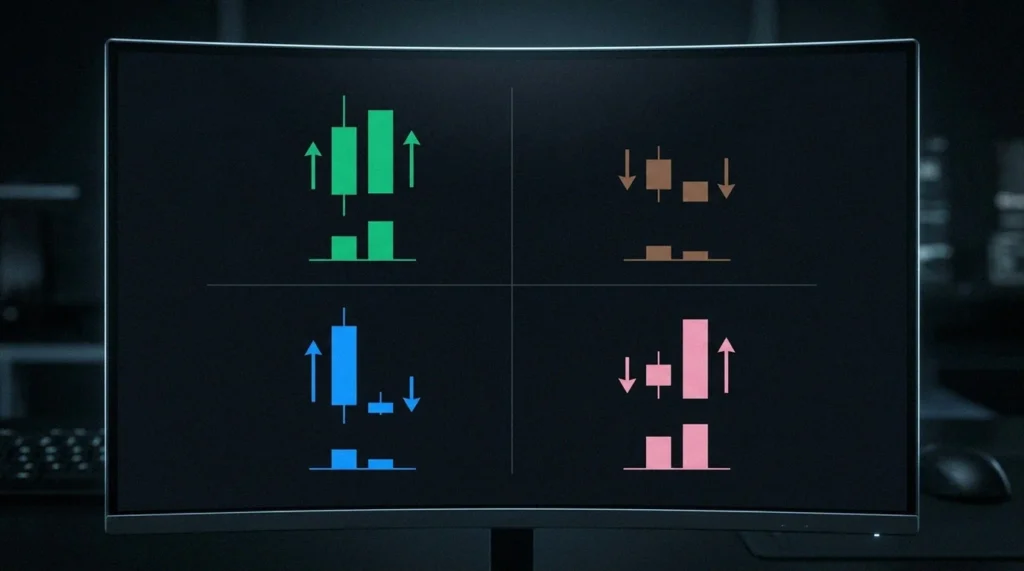
Bill Williams named the four combinations and gave each a colour. Learning these four is learning the indicator.
| Bar (colour) | MFI | Volume | What it tells you |
| Green | Up | Up | New money is entering and driving price. The move has backing and the trend is likely to continue. |
| Fade (brown) | Down | Down | Interest is draining out of the market. The current move is running out of participants and may be ending. |
| Fake (blue) | Up | Down | Price is moving on thin volume. The move is not supported and is prone to reversing, so treat it with suspicion. |
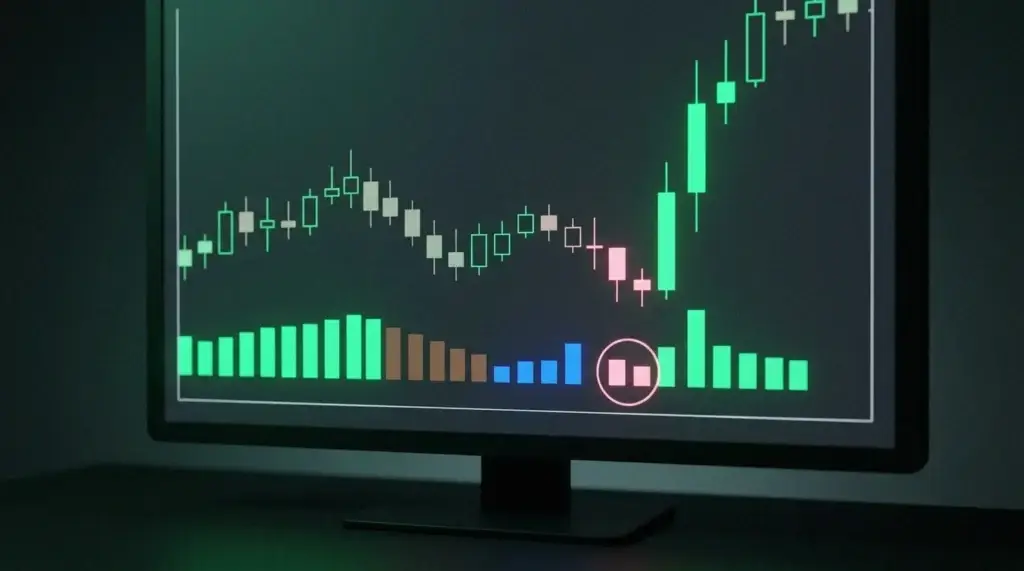
| Squat (pink) | Down | Up | Heavy volume, little price movement. Buyers and sellers are fighting hard. A squat bar often precedes a strong breakout once one side wins. |
The squat bar is the one experienced traders watch most closely. High volume that fails to move price is a coiled spring: the fight is intense, someone is absorbing the pressure, and when the deadlock breaks the move can be sharp. A green bar confirms a trend already in motion, while a fake bar warns you off a move that looks stronger than it is. A cluster of squat bars at a level often sets up the next breakout.
How do you trade the market facilitation index?
The MFI works as confirmation and context rather than a standalone entry trigger. Here is how to fold it into a plan.
- Establish the trend and your primary setup first, using structure, a moving average, or another system to decide direction and find a potential entry. The MFI then judges the quality of that move.
- Confirm continuation with green bars. A run of green bars in the direction of your trend says new participants are backing the move, which supports staying in or adding to a position.
- Respect fake bars. If price is pushing your way but the MFI prints fake bars, the move lacks volume, so tighten risk or wait for cleaner confirmation before committing.
- Prepare for squat breakouts. When a squat bar appears at a key level, set your orders for the resolution, because the direction price finally breaks is often the trade.
- Read fade bars as an exit cue. Fade bars during a trade warn that interest is leaving, which is a reason to tighten the stop or take partial profit.
Williams designed the MFI to sit alongside the Alligator and the Awesome Oscillator in a single framework. You do not have to run all three, but the principle holds: the market facilitation index is most powerful as a second opinion on a signal you already have, whether that comes from Williams’ own tools or a trend gauge such as the Aroon indicator.
Market facilitation index vs money flow index: what is the difference?
Both are abbreviated MFI, which causes constant confusion, yet they are unrelated indicators. The market facilitation index is Bill Williams’ range-over-volume measure that produces the four coloured bars above. The money flow index is a momentum oscillator, bounded from 0 to 100, that uses price and volume to flag overbought and oversold conditions, much like a volume-weighted RSI.
If someone talks about an MFI reading above 80 or below 20, they mean the money flow index. If they talk about green, fade, fake, and squat bars, they mean the market facilitation index. Keep the two straight, because they answer different questions and are traded in completely different ways.
What are the limitations of the market facilitation index?
The market facilitation index depends entirely on volume, and that is its main constraint. Spot forex has no centralised volume figure, because the market is decentralised, so charts use tick volume, the count of price changes, as a proxy. Tick volume correlates reasonably well with real activity, but it is not the same thing, so read forex MFI signals with that caveat in mind. On exchange-traded instruments with true volume, the signal is cleaner.
The indicator is also interpretive rather than mechanical. It does not print a buy or sell; it colours the context, and you supply the decision. That flexibility is a strength for experienced traders and a trap for beginners who want a clear signal. Pair it with structure, a defined risk plan, and a complementary read such as volume divergence. On leveraged CFDs a misread breakout can move fast, so a stop and a fixed risk-per-trade are not optional.
How can you trade MFI setups on Volity?
Volity is an all-in-one money hub, with your wallet, payments, and trading in one account. The charting in Volity MT plots the market facilitation index alongside volume across more than 40 forex pairs, global indices, commodities, and crypto, so you can watch for green confirmation, fake warnings, and squat breakouts on any instrument and attach a stop-loss and take-profit at entry. It sits within a fuller set of technical indicators you can layer on the same chart.
Because the MFI is a breakout and continuation tool, it fits two-directional CFD trading, where you can position for the resolution of a squat in either direction. Leverage reaches up to 1:500 on selected forex pairs, 1:100 on commodities, and 1:50 on crypto, with margin shown before every order and negative balance protection in place. Opening an account costs nothing, a demo lets you practise the read risk-free, and a live position can start from as little as $1. Execution is regulated by the Cyprus Securities and Exchange Commission through UBK Markets, licence 186/12. Leverage magnifies gains and losses alike, so size every position against a stop and check the published charges and fees before you commit real money.
Related patterns
Frequently asked questions
Who created the market facilitation index?
The market facilitation index was developed by Bill Williams and introduced in his book Trading Chaos. It belongs to a wider framework that also includes the Alligator and the Awesome Oscillator, all built to read the underlying structure of a market rather than to fire mechanical buy and sell signals.
What is a squat bar on the market facilitation index?
A squat bar prints when volume rises but the market facilitation index falls, meaning heavy trading produced little price movement. It signals an intense battle between buyers and sellers, with one side absorbing the other. Squat bars often appear just before a strong breakout, so traders watch the level closely for the resolution.
Is the market facilitation index the same as the money flow index?
No. They share the MFI abbreviation but are different indicators. The market facilitation index divides a bar’s range by its volume and produces four coloured bars. The money flow index is a 0 to 100 momentum oscillator that flags overbought and oversold conditions. Do not confuse the two.
Can you use the market facilitation index in forex?
Yes, with one caveat. Spot forex has no central volume figure, so the market facilitation index uses tick volume as a proxy. That works reasonably well for reading participation, though it is not identical to true traded volume. On exchange-traded instruments the volume data, and therefore the MFI signal, is more precise.