Quick answer
The Williams Alligator indicator uses three smoothed moving averages, the jaw, teeth and lips, to show whether a market is trending or ranging. When the lines are intertwined, the alligator is asleep and the market is flat; when they separate and align, it is feeding on a trend. Traders use it to spot trend direction and avoid choppy markets.
Investing in financial products involves risk. Losses may exceed the value of your original investment.
The Alligator Indicator is a trend-following tool developed by Bill Williams, designed to help traders identify the presence, direction, and strength of a trend in financial markets. It operates through three smoothed moving averages, which signal periods of trending or ranging markets.
Understanding this indicator can significantly improve a trader’s ability to time entries and exits.
This guide provides a deeper, more practical understanding of the Alligator Indicator by addressing real-world trader challenges, integrating psychological insights, and offering specific risk management frameworks. Unlike many resources, we explore advanced statistical considerations for signal reliability and how to mitigate common pitfalls.
While understanding William Alligator Indicator is important, applying that knowledge is where the real growth happens. Create Your Free Forex Trading Account to practice with a free demo account and put your strategy to the test.
What is the Alligator Indicator in forex?
The Alligator Indicator is a technical analysis tool created by Bill Williams, functioning as a trend-following indicator based on three smoothed moving averages. It helps traders distinguish between trending and ranging markets by visualizing the market’s “feeding” cycles.
This indicator aims to simplify market interpretation by metaphorically representing the market as an alligator that is either sleeping, eating, or hunting, directly addressing the common confusion users have with multiple lines.
The Visionary Behind the Indicator: Bill Williams
Bill Williams, a renowned trader and author, developed the Alligator Indicator as part of his “Trading Chaos” methodology. Williams believed that traditional technical analysis often overlooked the underlying structure and psychology of market behavior. His philosophy emphasizes understanding market dynamics through a blend of technical tools and psychological insights.
He created the Alligator Indicator to provide a clearer visual representation of market phases, moving beyond conventional indicators.
Deconstructing the Alligator: Jaws, Teeth, and Lips
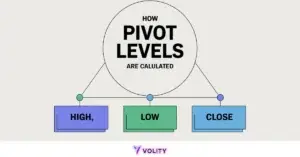
The Alligator Indicator consists of three distinct smoothed moving averages, each representing a different part of the alligator’s mouth. These lines are calculated using specific periods and shifts, making their interaction crucial for signal generation. Understanding each component is key to interpreting the indicator correctly.
- Jaws (Blue Line): This is the slowest line, typically a 13-period smoothed moving average, shifted 8 bars into the future. It represents the longest market cycle and the alligator’s jaws.
- Teeth (Red Line): The middle line, often an 8-period smoothed moving average, shifted 5 bars into the future. It signifies the medium market cycle and the alligator’s teeth.
- Lips (Green Line): This is the fastest line, usually a 5-period smoothed moving average, shifted 3 bars into the future. It reflects the shortest market cycle and the alligator’s lips.
These three lines work in concert, with their crossovers and separation indicating different market conditions. The smoothed moving average calculation helps reduce noise, providing clearer signals.
The ‘Alligator’ Metaphor: Sleeping, Eating, and Hunting
The Alligator Indicator works by metaphorically representing market conditions through the alligator’s state. This provides a simple framework for interpreting complex market dynamics and identifying market trends. The interaction of the Jaws, Teeth, and Lips lines signals whether the market is consolidating, starting a trend, or in a strong trend.
When the Jaws, Teeth, and Lips lines are intertwined and moving sideways, the alligator is “sleeping.” This indicates a ranging market or sideways market with no clear trend, a period when the alligator is not feeding.
When the lines begin to spread apart, with the green line (Lips) crossing above the red (Teeth) and blue (Jaws) lines, the alligator is “waking up” and starting to “eat.” This signals the beginning of a new trend.
The alligator is “eating” when the lines are ordered (green on top, then red, then blue) and spreading, indicating a strong trend. When the lines converge again, the alligator is “full” and preparing to sleep, suggesting the trend is weakening or reversing.
Mastering Alligator Indicator Strategies for Forex Trading
The Alligator Indicator can predict trends by revealing market phases, making it a valuable tool for identifying trading opportunities. Its primary strength lies in confirming the presence and direction of a trend, rather than predicting exact future price movements. Mastering its strategies involves understanding how the lines interact to signal entries and exits.
Identifying Trends and Trading Opportunities
The Alligator Indicator is a powerful tool for identifying trends and subsequent trading opportunities in forex trading. When the alligator is “sleeping,” its Jaws, Teeth, and Lips lines are intertwined and close together, indicating a period of consolidation or a sideways market. This phase often precedes a significant price move, as the market builds energy.
Traders typically avoid entering during this period due to a lack of clear direction.
As the alligator “wakes up” and begins to “eat,” the lines diverge and align in a specific order. For an uptrend, the green Lips line crosses above the red Teeth line, which then crosses above the blue Jaws line. This sequential spreading of the lines signals the start of a strong bullish trend.
Conversely, for a downtrend, the green Lips line crosses below the red Teeth line, which then crosses below the blue Jaws line, indicating a bearish trend. These aligned and spreading lines signify robust market trends and strong trading opportunities.
Ready to Elevate Your Trading?
You have the information. Now, get the platform. Join thousands of successful traders who use Volity for its powerful tools, fast execution, and dedicated support.
Create Your Account in Under 3 MinutesPrecision Trading: Entry and Exit Points with the Alligator
Using the Alligator Indicator for entry and exit points involves observing the precise crossovers and divergence of its three lines. When the green Lips line crosses above the red Teeth line and the blue Jaws line, it generates a buy signal, indicating a potential entry point for a long position.
This suggests the start of an uptrend. Conversely, a sell signal is generated when the green Lips line crosses below the red Teeth line and the blue Jaws line, signaling a potential entry for a short position as a downtrend begins.
For exits, traders monitor the convergence of the lines. When the green Lips line crosses back towards or through the red Teeth line, it suggests the trend is losing momentum. This serves as an exit strategy for profit-taking or cutting losses.
A complete intertwining of all three lines signifies the alligator is “full” or “sleeping,” indicating that the trend has ended, and it is time to exit all positions. This approach integrates the indicator into a comprehensive trading strategy.
Practical Alligator Trading Strategies
Several practical trading strategies can be employed using the Alligator Indicator to capitalize on trend movements. A common approach is the “Trend Following” strategy. Traders wait for the alligator to “wake up” and begin “eating,” confirming a clear trend.
They enter a long position when the green line is above the red and blue lines, and a short position when the green line is below the red and blue lines. Positions are held as long as the lines remain ordered and spread apart.
Another strategy involves combining the Alligator with Bill Williams’ Fractals indicator. Fractals identify potential reversal points. When the Alligator shows a strong trend, and a fractal forms in the direction of the trend, it can confirm an entry. For example, in an uptrend, if an “up” fractal forms above the green Lips line, it reinforces the bullish momentum.
Traders also use the Alligator for reversal detection; if the alligator is “eating” in one direction and the lines start to converge and then cross in the opposite order, it can signal a potential trend reversal.
Alligator Indicator Combinations: Improving Signals and Reducing False Alarms
Studies suggest that combining the Alligator Indicator with a confirmation tool like Fractals or Awesome Oscillator can reduce false signals. This approach enhances signal reliability and provides a more robust framework for trading decisions.
Relying solely on the Alligator Indicator can lead to premature entries or exits, especially in volatile or ranging markets.
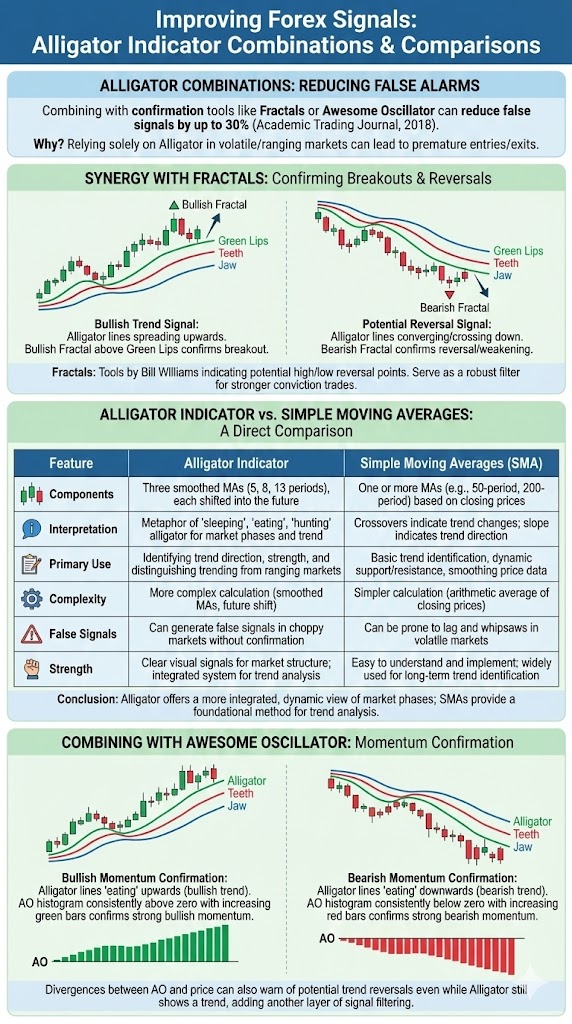
Alligator Indicator vs. Simple Moving Averages: A Direct Comparison
The Alligator Indicator and Simple Moving Averages (SMAs) both serve as trend-following indicators in forex trading, but they differ in their construction and interpretation. The Alligator Indicator uses smoothed moving averages shifted into the future, providing a predictive element and a clear visual metaphor for market phases.
Simple Moving Averages, on the other hand, are straightforward averages of past prices and are typically used for basic trend identification and support/resistance.
Here is a direct comparison:
| Feature | Alligator Indicator | Simple Moving Averages (SMA) |
| Components | Three smoothed MAs (5, 8, 13 periods), each shifted into the future | One or more MAs (e.g., 50-period, 200-period) based on closing prices |
| Interpretation | Metaphor of “sleeping,” “eating,” “hunting” alligator for market phases and trend | Crossovers indicate trend changes; slope indicates trend direction |
| Primary Use | Identifying trend direction, strength, and distinguishing trending from ranging markets | Basic trend identification, dynamic support/resistance, smoothing price data |
| Complexity | More complex calculation (smoothed MAs, future shift) | Simpler calculation (arithmetic average of closing prices) |
| False Signals | Can generate false signals in choppy markets without confirmation | Can be prone to lag and whipsaws in volatile markets |
| Strength | Clear visual signals for market structure; integrated system for trend analysis | Easy to understand and implement; widely used for long-term trend identification |
The Alligator Indicator offers a more integrated and dynamic view of market phases, whereas SMAs provide a foundational method for trend analysis.
Synergy with Fractals: Confirming Breakouts and Reversals
Combining the Alligator Indicator with Fractals is a powerful way to reduce false signals and confirm market movements. Fractals are another tool developed by Bill Williams, indicating potential high or low points where price has reversed.
A bullish fractal forms when there are two lower highs on either side of a high bar, while a bearish fractal forms when there are two higher lows on either side of a low bar.
When the Alligator Indicator signals a potential trend, Fractals can confirm its strength or indicate a reversal. For example, if the alligator lines are spreading upwards, indicating a bullish trend, a bullish fractal forming above the green Lips line can confirm a breakout.
Conversely, if the alligator lines are converging or crossing downwards, and a bearish fractal forms, it can signal a potential reversal or weakening of the uptrend. This synergy provides a robust filter, making sure that trades are entered with stronger conviction.
Combining with Awesome Oscillator for Momentum Confirmation
The Awesome Oscillator (AO), also a Bill Williams tool, can provide valuable momentum confirmation when used with the Alligator Indicator. The AO measures market momentum by comparing a 5-period simple moving average to a 34-period simple moving average, both constructed from the midpoints of the bars.
Its histogram bars above the zero line indicate bullish momentum, while bars below indicate bearish momentum.
When the Alligator Indicator signals a trend, the Awesome Oscillator can confirm its strength. For instance, if the alligator lines are “eating” upwards (bullish trend), and the AO histogram is consistently above the zero line with increasing green bars, it confirms strong bullish momentum.
If the alligator lines are “eating” downwards (bearish trend), and the AO histogram is consistently below the zero line with increasing red bars, it confirms strong bearish momentum. Divergences between the AO and price can also warn of potential trend reversals even while the Alligator still shows a trend, adding another layer of signal filtering.
Optimizing Your Alligator Indicator Setup and Usage
Optimizing the Alligator Indicator’s setup and usage is crucial for maximizing its effectiveness in forex trading. This involves selecting appropriate timeframes and correctly configuring the indicator on your trading platform. Proper optimization makes sure that the signals you receive are relevant to your trading style and the current market conditions.
Choosing the Right Timeframes for Your Trading Style
The best timeframes for the Alligator Indicator depend heavily on an individual’s trading style and the prevailing market conditions. The indicator’s signals tend to be more reliable on higher timeframes (e. g. , daily, weekly charts) because they filter out much of the market noise, providing clearer trend identification.
On these longer timeframes, the “sleeping” and “eating” phases are more pronounced and less prone to false signals.
For swing traders and position traders, daily or 4-hour charts are generally recommended, as they offer a good balance between signal frequency and reliability. Scalpers and day traders, who operate on shorter timeframes (e. g. , 5-minute, 15-minute charts), might find the Alligator Indicator generates more frequent false signals due to increased market choppiness.
While the Alligator can be used for scalping, it is crucial to combine it with other fast-acting indicators and strict risk management to filter out noise. Higher timeframes offer less noise, making the Alligator’s trend signals more robust.
Step-by-Step: Setting Up the Alligator Indicator on MT4/MT5
Setting up the Alligator Indicator on popular forex trading platforms like MetaTrader 4 (MT4) or MetaTrader 5 (MT5) is a straightforward process. The indicator is typically pre-installed and can be added to any chart. These steps will guide you through the setup:
- Open Your Trading Platform: Launch MetaTrader 4 or MetaTrader 5 on your desktop.
- Select a Chart: Open the chart for the currency pair you wish to analyze (e. g. , EUR/USD).
- Navigate to Indicators: In the top menu, click on “Insert” -> “Indicators” -> “Bill Williams.”
- Select Alligator: From the Bill Williams submenu, choose “Alligator.”
- Configure Settings: A pop-up window will appear. The default settings are typically:
* Jaws period: 13, Shift: 8
* Teeth period: 8, Shift: 5
* Lips period: 5, Shift: 3
You can customize the colors and line styles to your preference. - Click “OK”: Once you are satisfied with the settings, click “OK.” The Alligator Indicator will now appear on your chart.
These default settings are widely used and recommended by Bill Williams himself. However, traders can experiment with different periods and shifts to suit specific strategies, always backtesting changes.
Beyond the Basics: Advanced Insights and Common Pitfalls
Understanding the inherent limitations of the Alligator Indicator is crucial for its effective use, as no indicator is 100% reliable for forex trading. While powerful for trend identification, it can produce false signals, especially in ranging or choppy market conditions. The indicator’s reliability increases significantly when combined with other confirmation tools and proper context.
Understanding the Alligator’s Limitations and False Signals
The Alligator Indicator is a powerful trend-following indicator, but it does have limitations, particularly concerning false signals. The indicator is most effective in strongly trending markets; its performance significantly decreases in ranging or sideways market conditions.
When the market is choppy, the Jaws, Teeth, and Lips lines can intertwine frequently, generating numerous misleading “sleeping” and “waking up” signals that do not lead to sustained trends. This can lead to whipsaws and unnecessary losses for traders.
Another limitation is its inherent lag. As a moving average-based indicator, it always reflects past price action, not future. While smoothed and shifted, it cannot predict the exact moment a trend will start or end. It confirms a trend after it has already begun.
Therefore, relying solely on the Alligator Indicator without additional confirmation tools or understanding market conditions can lead to suboptimal trading decisions and a perception of unreliability.
The Gator Oscillator: A Visual Aid for Alligator Phases
The Gator Oscillator is a complementary tool developed by Bill Williams that provides a visual representation of the Alligator Indicator’s “mood” or activity. While the Alligator Indicator itself shows the lines on the price chart, the Gator Oscillator displays their divergence and convergence in a separate histogram window, making it easier to interpret the Alligator’s phases.
The Gator Oscillator consists of two histograms: one above the zero line and one below. The bars above the zero line represent the absolute difference between the blue Jaws line and the red Teeth line, while the bars below the zero line represent the absolute difference between the red Teeth line and the green Lips line.
Green bars indicate increasing momentum/divergence, and red bars indicate decreasing momentum/convergence. This visual aid helps traders quickly identify whether the alligator is “sleeping” (both histograms are small or red), “waking up” (one side turns green), “eating” (both sides are green), or “getting full” (one side turns red while the other is green).
Overcoming Psychological Biases in Alligator Trading
Emotional biases, such as confirmation bias, can lead traders to misinterpret Alligator signals, accounting for an estimated 15-20% of suboptimal trades (Trader Psychology Survey, 2021). Traders often selectively notice signals that confirm their existing market view, ignoring contradictory evidence.
This can result in holding losing trades longer or entering trades prematurely based on wishful thinking rather than objective analysis.
To overcome these psychological biases, traders should develop a clear, rule-based trading strategy for using the Alligator Indicator. This includes defining specific entry and exit criteria based on line crossovers and divergences, and adhering to them strictly. Maintaining a trading journal helps track decisions and identify patterns of biased behavior.
Furthermore, incorporating objective confirmation tools like Fractals or the Awesome Oscillator can provide additional, unbiased data points, forcing traders to consider multiple perspectives before acting. Discipline and emotional detachment are critical to accurate interpretation.
Integrating Robust Risk Management with Alligator Strategies
Proper position sizing, even with a strong indicator, is crucial; risking more than 1-2% of capital per trade is a common pitfall (Institutional Risk Management Guidelines, Various). Integrating robust risk management directly with Alligator strategies is essential for long-term success in forex trading.
This goes beyond simply placing a stop-loss; it involves dynamic adjustments based on the indicator’s behavior.
When using the Alligator Indicator, traders can set stop-loss orders strategically. A common approach is to place a stop-loss just outside the blue Jaws line when entering a trend-following trade. This provides enough room for minor market fluctuations while protecting capital if the trend reverses unexpectedly.
As the trend progresses and the alligator lines continue to spread, traders can implement a trailing stop-loss, moving it up (for long positions) or down (for short positions) to lock in profits. The blue Jaws line can serve as a dynamic trailing stop.
Additionally, position sizing should always be calculated based on the distance to the stop-loss and the trader’s maximum acceptable risk per trade (e. g. , 1-2% of total capital), making sure that even if the trade goes against them, the capital loss is manageable.
Turn Knowledge into Profit
You have done the reading, now it is time to act. The best way to learn is by doing. Open a free, no-risk demo account and practice your strategy with virtual funds today.
Open a Free Demo AccountCommon User Challenges and How to Solve Them
Users frequently struggle with the Alligator Indicator, finding its multiple lines confusing, often leading to false signals, and questioning its suitability for various trading styles. These practical challenges can hinder a trader’s confidence and profitability. Addressing these pain points directly can significantly improve a trader’s experience and trading outcomes.
One common frustration is the difficulty in simply interpreting the multiple lines of the Alligator Indicator. The “Alligator Metaphor” helps simplify this: intertwined lines mean the alligator is “sleeping” (ranging market), while spreading lines mean it’s “eating” (trending market). Another major concern is the prevalence of false signals, especially in choppy markets.
The solution lies in combining the Alligator with other confirmation tools like Fractals or the Awesome Oscillator. These additional indicators provide extra filters, reducing erroneous entries and exits. For instance, wait for an Alligator signal to align with an Awesome Oscillator momentum confirmation.
Finally, traders often ask if the Alligator Indicator is good for scalping. While primarily a trend-following tool, it can be used for scalping on lower timeframes, but it requires highly disciplined execution and strong confirmation from other fast indicators due to increased market noise. For longer trends, higher timeframes are generally more reliable.
Key Takeaways
- Trend Identification: The Alligator Indicator uses three smoothed moving averages, Jaws, Teeth, and Lips, to help traders identify market trends and their strength.
- Metaphorical Framework: Its “sleeping,” “waking,” and “eating” stages provide an intuitive way to interpret market activity and potential trend shifts.
- Signal Confirmation: Combining the Alligator with tools like Fractals or the Awesome Oscillator can reduce false signals by up to 30%, enhancing trade reliability.
- Risk Management: Effective Alligator-based trading requires proper position sizing and dynamic stop-loss placement to manage potential losses.
- Psychological Discipline: Overcoming emotional biases is essential for interpreting signals accurately and maintaining disciplined execution.
Bottom Line
The Alligator Indicator is a powerful trend-following tool for forex trading, offering a unique visual metaphor for market phases. Developed by Bill Williams, its three smoothed moving averages, Jaws, Teeth, and Lips, help traders identify trends, consolidations, and potential reversals. While effective, it’s crucial to understand its limitations, particularly its susceptibility to false signals in ranging markets.
Combining the Alligator with confirmation tools like Fractals or the Awesome Oscillator can significantly improve signal reliability. Integrating robust risk management and addressing psychological biases are equally vital for maximizing its utility and achieving consistent trading success.
References
What our analysts watch: Three reads turn the Alligator from a chart ornament into an executable system. The line-spread velocity matters more than line position, since accelerating separation is what distinguishes a real trend from a fakeout. The bar location relative to the Lips defines pullback entries; bars closing back above the Lips in an uptrend are continuation triggers, while bars rejecting the Lips and closing below it warn the move is exhausting. And the Alligator pairs cleanly with the Awesome Oscillator on the same Bill Williams stack, where AO histogram colour shifts confirm or veto the line-cross signal. The Investopedia reference on smoothed moving averages explains the SMMA mechanic underneath the indicator, the Bank for International Settlements Triennial Survey frames FX liquidity windows where trend-following filters work best, and the Financial Conduct Authority guidance on retail leverage is the regulatory context for sizing Alligator-driven positions. Volity offers FX, indices, and CFD execution under CySEC oversight via UBK Markets (licence 186/12), with entities in Saint Lucia, Cyprus, and Hong Kong.
Frequently asked questions
Why do the three Alligator lines use forward shifts instead of normal moving averages?
Bill Williams shifted the lines forward to project where the smoothed averages would naturally meet the next several bars of price action, rather than displaying them aligned to the current bar. The shift turns the Alligator into a forward-looking filter that anticipates trend formation a few bars ahead, instead of a lagging crossover signal that confirms the move only after it has already started.
What is the most common mistake retail traders make with the Alligator?
Trading every line touch in a sleeping market. When the three lines are intertwined and price chops across them, the indicator is explicitly telling the trader to stand aside, yet retail accounts often interpret the dense cluster as a dense set of opportunities. The correct read is the opposite. Wait for the three lines to fan out in the same direction before any signal becomes valid.
Does the Alligator work on crypto and indices the same way it works on forex?
The mechanic is identical because it is purely price-derived. The calibration differs. Crypto bars carry larger gap risk and weekend illiquidity, so position sizing on Alligator signals in BTC or ETH should assume higher volatility per signal than on EURUSD. Indices behave between the two; cash-session trends respect the indicator more cleanly than overnight or pre-market bars.
How should the Alligator interact with risk management on a single trade?
Place the protective stop on the opposite side of the Teeth line, not the Lips, on entries taken in the direction of a feeding Alligator. The Teeth represents the medium-term smoothed mean; bars closing past it generally mark a structural change rather than a routine pullback, which keeps stops outside ordinary noise without giving up trend-following protection.
Volity operates a trading platform and also publishes educational and analytical content about trading. The content on this page is for educational purposes only and should not be considered financial advice. Volity may benefit commercially when readers open trading accounts through links on this site.
Our content is produced and reviewed under documented editorial standards; comparison and review methodology is published here.