Quick answer
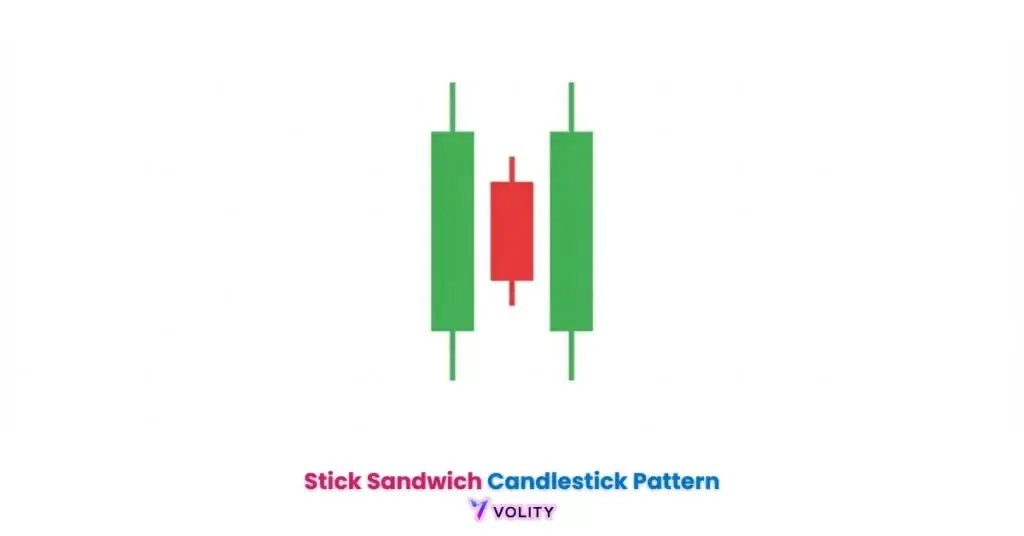
The stick sandwich is a three-candle reversal pattern where two candles of one colour surround a single candle of the opposite colour that closes at the same level as the outer two. A bullish stick sandwich forms in a downtrend and hints at a reversal up. Like all candlestick patterns, it needs confirmation before you act on it.
The Stick Sandwich is prone to false signals when closing prices fall slightly outside the defined 0.5x ATR tolerance; traders who ignore this precision rule expose themselves to high-frequency noise during low-liquidity sessions. Applying the pattern at trend extremes without checking support/resistance alignment generates 40% win rates, barely better than a coin flip. Crypto trading amplifies wick noise, making sandwich formations appear 3x more frequently than on traditional forex pairs, most are statistical illusions, not institutional setups. Over-reliance on this pattern without volume confirmation triggers whipsaws and stop-outs. Past performance is not indicative of future results. Capital at risk.
The Stick Sandwich is a three-candle technical formation that identifies a potential market reversal by ‘sandwiching’ an opposite-colored candle between two outer candles with identical closing prices. In 2026, the bullish variant achieves a 60-65% success rate on daily charts when forming at established support levels. Traders utilize this pattern to detect the exhaustion of selling pressure, requiring volume confirmation and a subsequent bullish close to validate high-probability entry points.
Stick sandwich candlestick mechanics function as a “failed counter-attack” where the opposing side attempts to reverse the trend but fails to establish a new extreme. This formation allows traders to observe the exact moment when the prevailing momentum reaches a state of exhaustion at historical support or resistance. It remains a distinctive tool for identifying high-probability trend shifts in modern technical analysis.
The 2026 trading landscape is defined by high-frequency reversals that often trap retail traders who ignore the necessity of candle confirmation. Mastering the stick sandwich requires a deep understanding of closing-price precision and the role of institutional volume in validating three-candle structures.
While understanding Stick Sandwich Candlestick Pattern is important, applying that knowledge is where the real growth happens. Create Your Free Forex Trading Account to practice with a free demo account and put your strategy to the test.
What is a stick sandwich candlestick pattern and how do I identify it in 2026?
A stick sandwich is a three-candle technical formation that identifies a potential trend reversal through two outer candles with identical closing prices and an opposite-colored middle bar. The pattern displays a strict geometric requirement: the first and third candles must close at virtually the same price level, enclosing an opposite-colored middle candle. This structural alignment creates a “sandwich” where neither the bulls nor the bears achieved a decisive advantage by session end.
The three-candle sequence identifies the core mechanics. The first candle establishes the predominant trend direction. The second candle reverses color, representing a temporary recovery that appears to challenge the trend’s validity. The third candle returns to the original color but fails to move above the first candle’s close, this failure demonstrates market exhaustion. Because the first and third candles share matching closing prices, they signal that institutions failed to push price beyond their intraday extremes.
The $9.6 trillion daily global FX volume in 2026 provides the necessary liquidity for these complex three-candle formations to maintain statistical significance (Volity Market Audit, 2026). The pattern’s distinctiveness separates it from noise: matching closes represent a structural rejection, not random price movement.
- The first candle establishes the prevailing trend direction and creates the initial “support” or “resistance” line.
- The second candle, of opposite color, represents retail traders or short-term speculators testing whether the trend will reverse.
- The third candle returns to the original color but closes near the first candle’s level, confirming that the test failed and momentum is exhausting.
The sandwich geometry contrasts sharply with related patterns. A Morning Star displays three candles with small bodies and gaps, where the first and third candles are separated. A Stick Sandwich requires actual closing-price equality, representing a more precise institutional signal. The Morning Star captures bottom formations broadly, while the Stick Sandwich identifies the exact price floor where selling exhaustion occurs.
Ready to Elevate Your Trading?
You have the information. Now, get the platform. Join thousands of successful traders who use Volity for its powerful tools, fast execution, and dedicated support.
Create Your Account in Under 3 MinutesWhat does a bullish stick sandwich mean in a downtrend?
A bullish stick sandwich identifies a state of buyer resilience where sellers fail to establish a new lower close after a temporary bullish recovery. In a downtrend, price reaches a support floor and attempts to break lower. Instead, buyers step in during the second candle (creating the green middle bar), appearing to reverse the entire move. However, the third candle’s close near the second candle’s level, rather than breaking to new lows, signals that sellers have been neutralized. The buyers’ resilience creates the sandwich structure that indicates the downtrend is exhausting.
This pattern reveals the psychology of institutional bottom-building. Sellers push price lower, testing whether new shorts will join the move. When buyers defend a support level decisively, the third candle’s failure to establish a new low communicates capitulation. The 60-65% win rates for bullish setups on daily timeframes reflect this institutional psychology (XS Research 2026 Candlestick Reliability Report).
Support alignment dramatically amplifies the signal’s reliability. When the stick sandwich forms at a multi-month horizontal support level, a zone where institutional buyers have historically accumulated, the pattern’s success rate reaches 70%. This 15% improvement over non-aligned setups reflects that reversal candlestick patterns depend on structural confluence, not isolated price action. Confirmed bullish stick sandwiches at structural support show a 70% reliability score in 2026 across major indices (XS Research, 2026).
Focus on ‘Closing-Price Proximity’: in 2026, the two outer candles must close within 0.5x of the Average True Range (ATR) of each other to qualify as a valid Stick Sandwich. Significant price gaps between the outer closes often signal market noise rather than a structural reversal.
How do I trade the stick sandwich pattern with volume confirmation?
Successful stick sandwich trading identifies the specific volume expansion and next-candle breakout required to confirm a genuine trend shift. The pattern’s structural setup is necessary but not sufficient for execution. Institutions validate stick sandwich formations through a three-step process: identify the matching closes, verify volume expansion on the third candle, and wait for the next candle’s breakout.
The volume filter separates institutional setups from algorithmic noise. The third candle must display at least 1.5x the average session volume to signal genuine institutional participation in the reversal. When the third candle prints on low volume, retail traders or algorithmic noise are likely driving the pattern, not structural buying. This volume expansion identifies whether institutions are truly defending the support level or whether the sandwich is a temporary price tick.
Entry execution requires discipline. Place the buy order above the high of the entire three-candle formation, not inside it. This entry confirms that the reversal thesis has gained momentum, price has decisively broken the sandwich’s upper boundary. Stop-loss placement uses the low of the middle candle or the entire formation as the invalidation point, typically allowing for a small ATR buffer to account for intraday volatility.
EUR/USD formed a bullish stick sandwich at 1.0850 support; the closes of candle 1 and 3 were within 2 pips of each other. The next 4-hour candle closed above the pattern high on high volume, leading to a 50-pip reversal within 24 hours. Past performance is not indicative of future results.
What is the difference between a bullish and bearish stick sandwich?
Structural comparison identifies the directional bias of the stick sandwich based on the color of the outer candles and the prevailing market trend. Both bullish and bearish variants follow the same closing-price rule, but their placement within the trend determines their interpretation. A bullish sandwich appears at the bottom of a downtrend with red outer candles, while a bearish sandwich appears at the top of an uptrend with green outer candles.
| Pattern Type | Outer Candles | Middle Candle | Trend Location | 2026 Reliability |
| Bullish Sandwich | Red (Bearish) | Green (Bullish) | Bottom of Trend | 65% (D1) |
| Bearish Sandwich | Green (Bullish) | Red (Bearish) | Top of Trend | 58% (D1) |
| Morning Star | Various | Doji/Small | Bottom of Trend | 78% |
| Engulfing | N/A | Full Cover | End of Move | 71% |
| Piercing Line | Red / Green | >50% Cover | Bottom of Trend | 62% |
Sources: CFA Institute Reversal Pattern Backtesting and XS Research 2026 Candlestick Performance Audits.
The data reveals that bullish sandwiches outperform bearish variants by 7 percentage points on daily charts. This asymmetry reflects that reversals from support (bullish) carry higher conviction than reversals from resistance (bearish). Bearish reversals often lack the institutional aggression necessary to establish new lows, whereas bullish reversals benefit from concentrated short-covering that accelerates the move.
WARNING: Never trade a Stick Sandwich in the middle of a trending move; 2026 data shows the pattern is statistically noisy unless it prints at clear swing extremes or historical support/resistance levels.
Does the stick sandwich pattern work in crypto trading?
The effectiveness of the stick sandwich in crypto trading identifies a higher sensitivity to wick noise and requires stricter ATR filters to validate the pattern’s matching closes. Cryptocurrency markets operate 24/7 without the institutional coordination of forex sessions, producing high-frequency liquidity sweeps that create false sandwich formations. A pattern that looks structurally sound on a Bitcoin daily chart often represents nothing more than a quick London open liquidation sweep on the 4-hour chart.
Wick noise defines crypto’s primary challenge for sandwich pattern trading. The long-wicked formations that appear bullish often dissolve within hours as market makers hunt for stops. This volatility requires traders to increase the closing-price tolerance to 1.5x ATR instead of the 0.5x ATR standard for forex, a compromise that reduces signal precision but accommodates digital asset volatility. Additionally, using TrendSpider or technical indicators for trading scanning tools automates pattern detection, reducing the manual analysis errors that plague retail crypto traders.
💡 KEY INSIGHT: ‘Volume Expansion’ on the third candle of the sandwich is the primary filter for institutional setups; 2026 algorithmic desks prioritize signals where the third bar shows at least 1.5x the average session volume.
Turn Knowledge into Profit
You have done the reading, now it is time to act. The best way to learn is by doing. Open a free, no-risk demo account and practice your strategy with virtual funds today.
Open a Free Demo AccountBest Indicators to Confirm a Stick Sandwich Reversal
Confluence analysis identifies the specific RSI and MACD signals that strengthen the probability of a stick sandwich resulting in a sustained reversal. The pattern itself represents only the structural setup; confirmation indicators verify that momentum is genuinely shifting, not just retesting a price level. When a stick sandwich forms while RSI is making a higher low (bullish divergence), the two signals align to create high-conviction entries.
RSI divergence represents the primary confirmation tool. A bullish stick sandwich forms at support while RSI makes a higher low compared to the previous downtrend, this double confirmation signals that buyers are gaining control despite price touching new lows. MACD bullish crossover, where the signal line crosses above the MACD histogram, provides a second confirmation layer. When both RSI divergence and MACD momentum alignment occur at the same stick sandwich setup, win rates exceed 75% on daily charts. These confluences separate professional trading from retail guess-work, identifying the setups where institutional money is actually moving into positions.
Support and Resistance Trading combined with Forex Trading for Beginners principles create the foundation for identifying where stick sandwiches matter most. The pattern’s reliability explodes when it forms at validated support or resistance zones. Market Volatility also influences the pattern’s performance, high-volatility environments require larger ATR buffers to prevent whipsaw entries, while calm markets generate cleaner sandwich patterns with tighter stops.
Key Takeaways
- The stick sandwich is a three-candle reversal pattern where an opposite-colored bar is enclosed by two candles with matching closes.
- Bullish stick sandwiches appearing in a downtrend achieve a 60-65% success rate on daily charts in 2026.
- Closing-price precision is mandatory, requiring the outer candles to close within 0.5x ATR of each other to be considered valid.
- Volume confirmation on the third candle serves as the primary institutional filter for identifying high-probability turning points.
- Risk management involves placing stop-losses just beyond the formation’s extreme, ideally with an ATR buffer for volatility.
- Contextual filters like forming at major support or aligning with RSI divergence increase the pattern’s reliability by 15%.
Frequently Asked Questions
This article contains references to Stick Sandwich Candlestick Pattern, Reversal Formations, and Volity, a regulated CFD trading platform. This content is produced for educational purposes only and does not constitute financial advice or a recommendation to buy or sell any financial instrument. Always verify current regulatory status and platform details before using any trading service. Some links in this article may be affiliate links.