The stochastic momentum index (SMI) is a refined version of the classic stochastic oscillator. Rather than measuring where price closes within the recent high-low range, the SMI measures where the close sits relative to the midpoint of that range, then double-smooths the result. The output swings between -100 and +100 and produces fewer false signals than a standard stochastic.
What is the stochastic momentum index?
William Blau created the stochastic momentum index and introduced it in 1993 in the pages of Technical Analysis of Stocks & Commodities, then expanded on it in his 1995 book Momentum, Direction, and Divergence. His aim was to fix a well-known weakness in the original stochastic, which is jumpy. The classic tool reacts to every close inside the lookback range, so it throws off frequent whipsaws when conditions turn choppy.
The SMI improves on this. First, it centres the calculation on the midpoint of the high-low range instead of the range floor, so a reading of zero means price is closing exactly in the middle of recent action. Second, it applies two rounds of exponential smoothing to filter the result. That gives a cleaner line, one that tracks the real momentum of a market and flips far less often on noise. That behaviour is what leads traders to call it a sharper stochastic.
Stochastic momentum index calculation
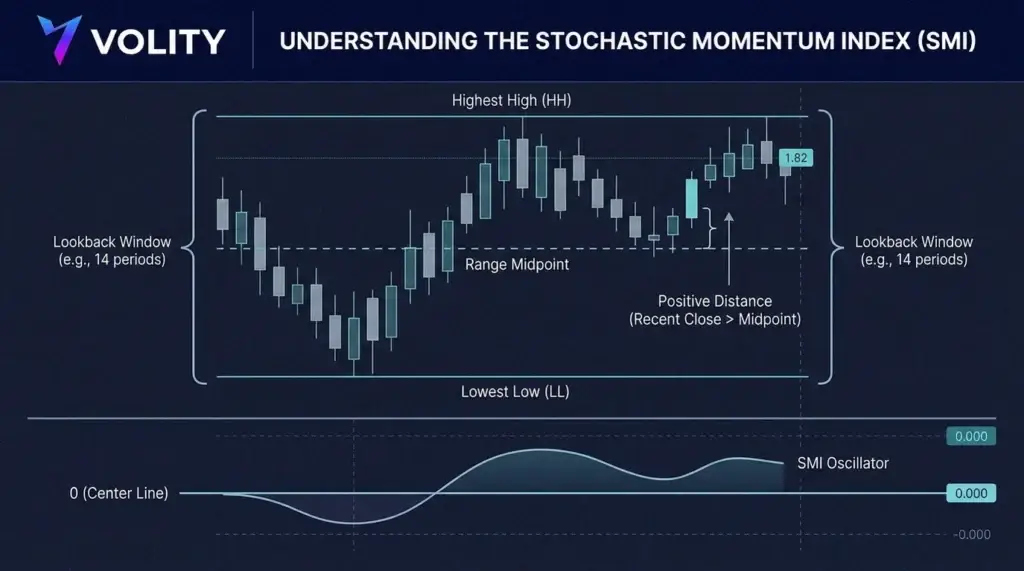
The stochastic momentum index calculation looks involved, but it breaks into clear steps, and the same method is documented by charting references such as StockCharts ChartSchool and the Corporate Finance Institute. Start with a lookback period, N, commonly set to 10 or 14 bars.
- Find the highest high (HH) and the lowest low (LL) over the last N bars to define the range.
- Measure the distance from the midpoint. M is the close minus the midpoint, where the midpoint is (HH + LL) / 2. A positive M means price is closing in the upper half of the range, and a negative M means the lower half.
- Measure the range size. D is HH minus LL.
- Double-smooth both values. Apply two exponential moving averages in sequence to M, and the same two to D divided by two. A typical setting is a 3-period then 3-period EMA.
- Form the SMI. SMI = 100 x (double-smoothed M / double-smoothed D/2), which scales the reading to a band between -100 and +100.
- Add the signal line. Take a short EMA of the SMI, often three periods. Crossovers between the SMI and this signal line are the main trade trigger.
You do not run the stochastic momentum index calculation by hand. Charting tools, including those inside Volity MT, plot the SMI and its signal line from raw price with adjustable inputs. Knowing the steps still helps, because it explains the SMI’s core behaviour: readings near +100 mean price has been closing repeatedly near the top of its range with strong upward momentum, while readings near -100 mean the opposite.
What does the SMI signal?
The stochastic momentum index gives four signals that map cleanly onto trading decisions.
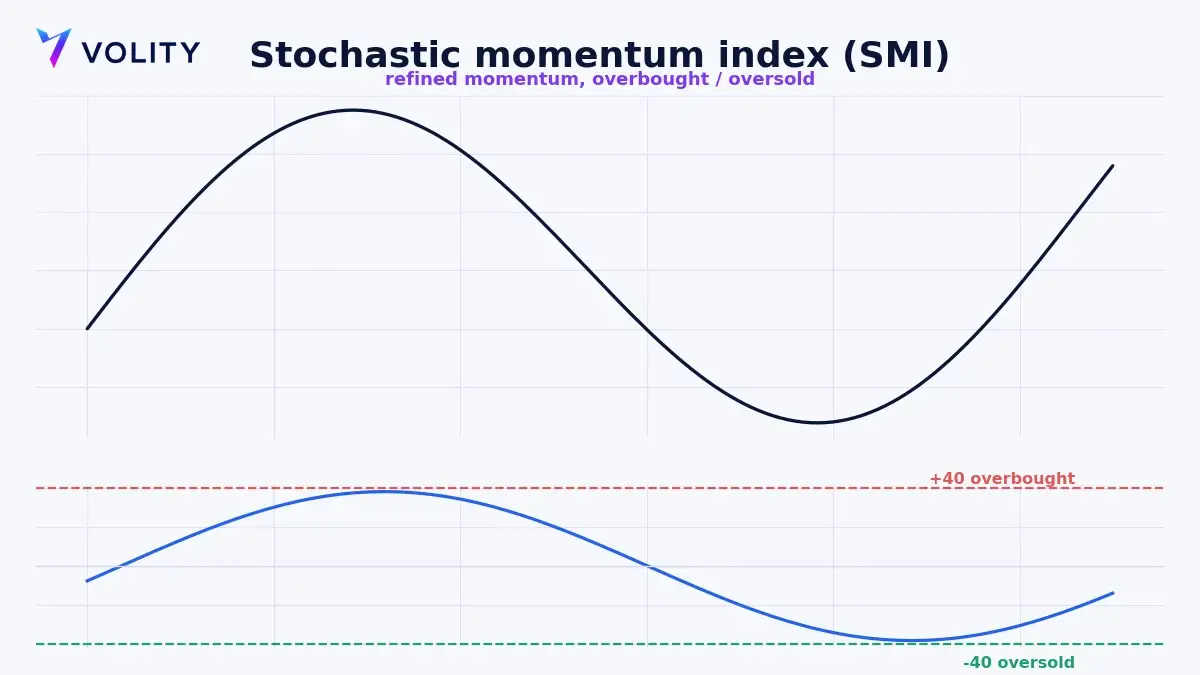
- Overbought and oversold readings. A value above +40 is commonly treated as overbought and a value below -40 as oversold. Some traders widen those bands to +50 and -50 on more volatile instruments. An extreme flags a stretched market rather than a guaranteed reversal.
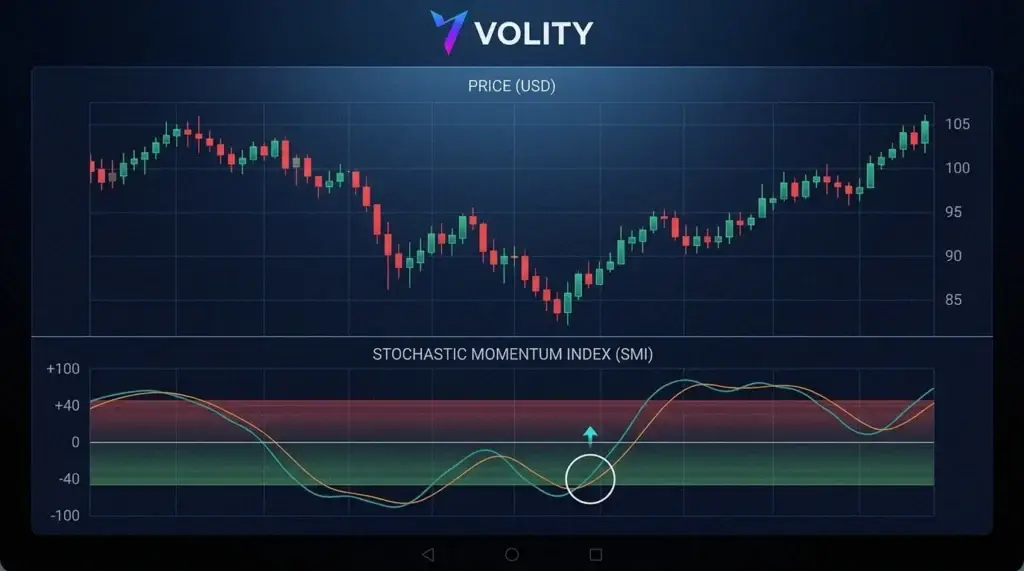
- Signal-line crossovers. The SMI crossing above its signal line is a bullish trigger, and crossing below is bearish. These carry more weight when they happen from an oversold or overbought zone.
- Zero-line crossovers. Because zero marks the range midpoint, an SMI move from negative to positive shows momentum shifting to the upside, and the reverse shows it shifting down. The zero line works well as a trend filter.
- Divergence. A higher price high against a lower SMI high warns that upside momentum is fading, and a lower price low against a higher SMI low warns the downside is losing steam. That kind of divergence often shows up before a turn.
How do you trade the stochastic momentum index?
A disciplined SMI routine combines the extremes, the crossover and the zero line, so you are not trading a single reading in isolation.
- Set your context first. Establish the higher-timeframe trend, because the SMI is a timing tool and the trend decides which direction of signal you favour.
- Wait for an extreme. Look for the SMI to reach oversold below -40 in an uptrend pullback, or overbought above +40 in a downtrend bounce.
- Take the crossover. Enter when the SMI crosses back through its signal line out of that extreme. The crossover is the trigger, so wait for it rather than acting on the extreme by itself.
- Confirm with the zero line. An SMI reading above zero for longs, or below zero for shorts, filters out weaker signals.
- Define risk and exit. Place the stop beyond the swing that produced the signal, and exit on the opposite crossover, a divergence against your position, or a set reward target.
The double smoothing means the SMI lags a little more than a raw stochastic, so it rewards patience. You give up the earliest tick of a move in exchange for far fewer false starts, a trade most swing traders are happy to make.
SMI vs the classic stochastic: what changed?
The two tools share a name and a family, but they are built differently. The comparison below shows why the SMI is considered the sharper of the two.
| Feature | Classic stochastic | Stochastic momentum index |
| Reference point | Close vs range low | Close vs range midpoint |
| Output range | 0 to 100 | -100 to +100 |
| Smoothing | Single (the %D line) | Double exponential |
| Overbought / oversold | 80 / 20 | +40 / -40 |
| Noise and false signals | Higher | Lower |
| Responsiveness | Faster, more erratic | Smoother, slightly slower |
If you already trade the classic stochastic, the SMI is a straightforward upgrade for trend-following and swing setups where cleaner signals matter more than raw speed. Scalpers who need the fastest possible read sometimes still prefer the original. The SMI also sits in the same family as the RSI and Williams %R, two other bounded momentum oscillators, though each measures a slightly different slice of price behaviour.
What are the limitations of the SMI?
No oscillator removes risk, and the stochastic momentum index has clear blind spots. In a strong trend the SMI can sit pinned in overbought or oversold territory for a long time, and traders who fade every extreme get run over. The double smoothing also adds lag, so at genuine turning points the confirmation arrives a little late. Like all momentum tools, the SMI describes the recent past and cannot see a news shock coming.
Use it as one component of a plan, alongside trend structure, volatility awareness and your broader set of technical indicators. On leveraged products such as CFDs, a false SMI signal is amplified in both directions, so a protective stop and a fixed risk-per-trade are essential. What protects the account is position sizing, well ahead of the indicator itself.
How can you trade the SMI on Volity?
Volity is an all-in-one money hub, with your wallet, payments and trading in one account. The charting in Volity MT plots the stochastic momentum index with adjustable lookback, smoothing and signal-line inputs, so you can run the same routine across more than 40 forex pairs, global indices, commodities and crypto. You can attach a stop-loss, take-profit and trailing stop to any position at the point of entry.
Because the SMI works in both directions, it fits naturally with CFD trading, where you can act on bullish and bearish crossovers alike. Forex is also the deepest market the tool is used in, with daily turnover measured in the trillions, which tends to give clean, repeatable reactions. Leverage reaches up to 1:500 on selected forex pairs, 1:100 on commodities and 1:50 on crypto, with margin shown before every order and negative balance protection in place. Because CFDs are leveraged, regulators such as ESMA restrict how they are sold to retail traders, and execution here is regulated by CySEC under UBK Markets, licence 186/12. You can open an account for nothing, rehearse on a demo, and fund from $1 to trade live. See the published charges and fees for the full cost picture.
Related patterns
Frequently asked questions
Is the stochastic momentum index better than the stochastic oscillator?
For most swing and trend-following setups, yes. The stochastic momentum index centres on the range midpoint and applies double smoothing, so it whipsaws less than the classic stochastic and gives cleaner crossover signals. Fast scalpers who want the earliest possible read sometimes still prefer the original, which reacts more quickly.
What are the best stochastic momentum index settings?
A common baseline is a lookback of 10 to 14 with 3-period double smoothing and a 3-period signal line, and overbought and oversold bands at +40 and -40. Shorten the inputs for faster signals or lengthen them for smoother ones, and test any change on historical data for your instrument before trading it live.
What does a positive SMI reading mean?
A positive stochastic momentum index reading means price is closing in the upper half of its recent high-low range, which signals upward momentum. A negative reading means price is closing in the lower half, signalling downward momentum. The further the SMI sits from zero, the stronger that momentum has been.
Can the SMI be used for day trading?
Yes. The stochastic momentum index works on any timeframe, including the short intraday charts day traders use. Because it is smoother than the classic stochastic, day traders often value the reduction in false signals, though they may shorten the settings to keep it responsive. On Volity MT you can apply it to every instrument in one account.