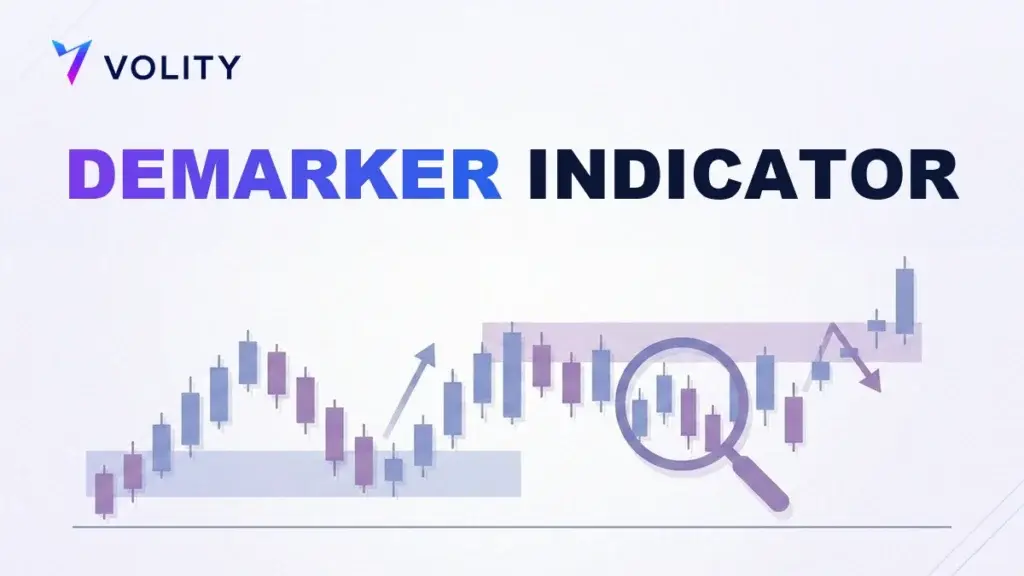
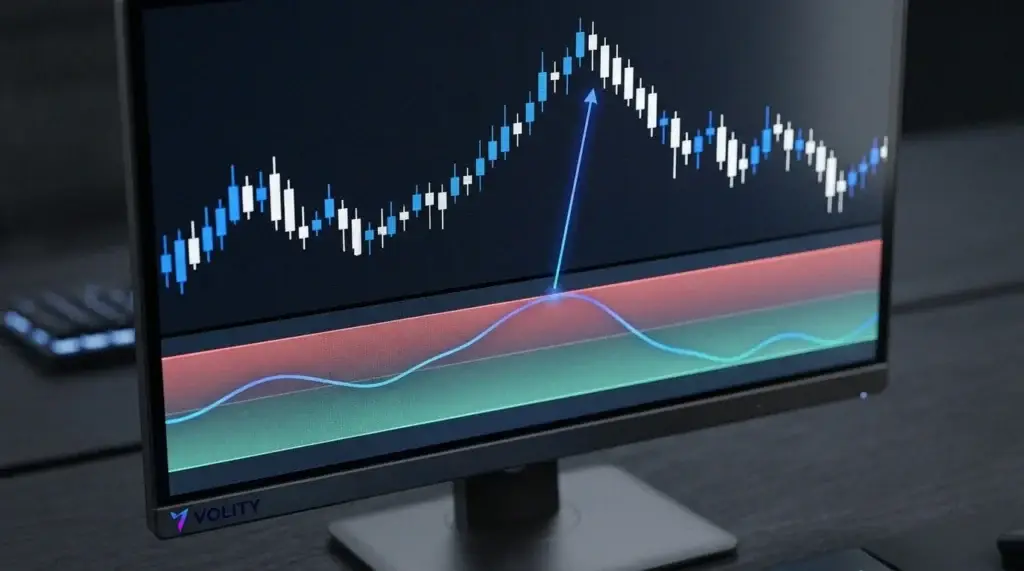
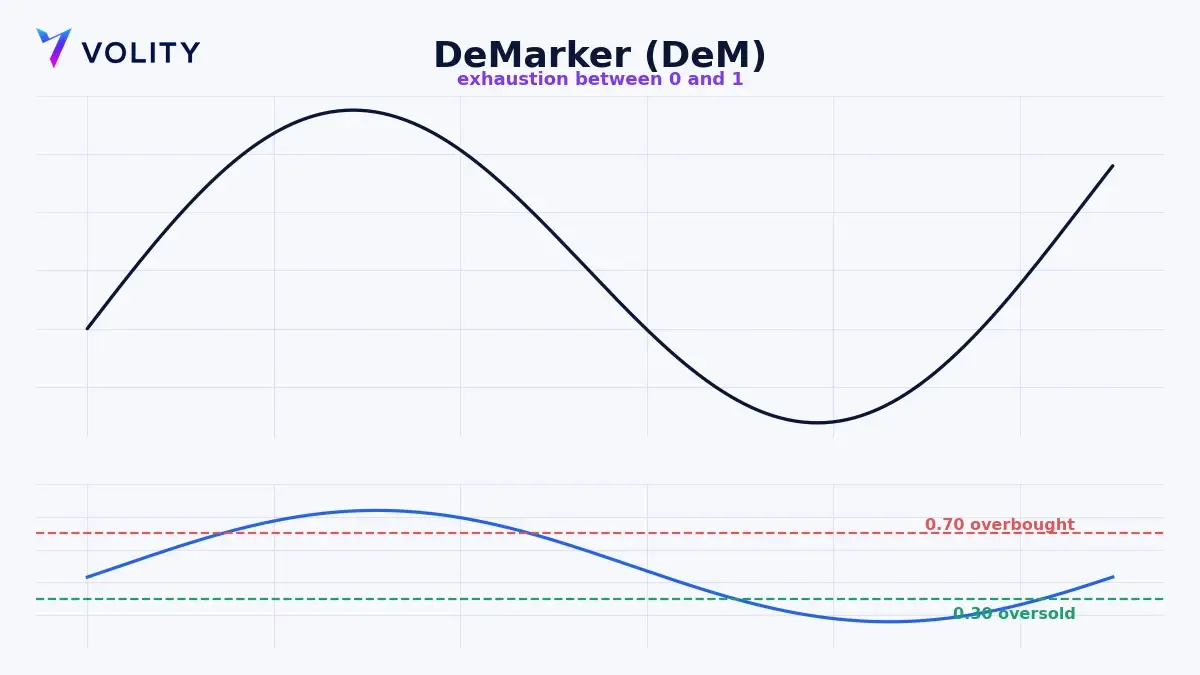
The DeMarker indicator, usually shortened to DeM, is a momentum oscillator that measures demand to flag price exhaustion and likely reversals. It compares each bar’s high and low against the previous bar’s to judge whether buyers or sellers are running out of steam, then plots the result as a line between 0 and 1. A reading above 0.7 points to overbought conditions and a reading below 0.3 points to oversold, which makes the DeM a quick read on whether a move has stretched too far.
What is the DeMarker indicator?
The DeMarker indicator was designed by Tom DeMark, a technical analyst whose tools are built to spot where a trend is losing steam. It belongs to the oscillator family, so it moves in its own window below the price chart rather than sitting on the candles. Its whole job is to answer one question: has the current move stretched so far that it is at risk of turning?
Where some oscillators lean on closing prices alone, the DeMarker looks at the highs and lows of each bar instead. By comparing the current bar’s extremes with the previous bar’s, it registers where buyers are forcing new highs and where sellers are pushing new lows. Many traders find the result smoother than older momentum tools, which makes the turns easier to read on a busy chart.
How is the DeMarker calculated?
The maths is straightforward once you break it into parts. For every bar the indicator records DeMax, the amount by which the current high exceeds the previous high, and DeMin, the amount by which the current low falls below the previous low. If the high is not higher, DeMax is zero for that bar. If the low is not lower, DeMin is zero. Each series is then averaged over a lookback period, most often 14 bars.
The DeMarker value is the average DeMax divided by the sum of the average DeMax and the average DeMin. That gives a figure between 0 and 1, where readings near 1 mean new highs dominate and readings near 0 mean new lows dominate. Some platforms rescale the output to run from 0 to 100, but the interpretation does not change: a high reading says demand is stretched, a low reading says supply is stretched.
What are the overbought and oversold levels?
The standard thresholds are 0.7 and 0.3. They mark the two states the DeM is built to catch, with the band in between treated as neutral.
| DeMarker reading | Condition | What it suggests |
| Above 0.7 | Overbought | Buying may be exhausted, a reversal or pause is more likely |
| 0.3 to 0.7 | Neutral | Trend intact, no exhaustion signal |
| Below 0.3 | Oversold | Selling may be exhausted, a bounce is more likely |
The catch worth remembering is that overbought does not mean sell and oversold does not mean buy. In a strong trend the DeMarker can sit above 0.7 or below 0.3 for a long stretch while price keeps running. The reading tells you the move is stretched, not that it has finished. Wait for the indicator to turn back out of the zone, or for price itself to confirm, before you act on it.
How do you trade with the DeMarker indicator?
Two classic methods cover most of what traders do with the DeM: fading exhaustion inside a range, and reading divergence for an early warning that a trend is tiring.
- In a ranging market, sell as the DeMarker turns back down out of the zone above 0.7, and buy as it turns up out of the zone below 0.3, aiming for the opposite side of the range.
- Watch for divergence. When price makes a higher high while the DeMarker makes a lower high, buying pressure is fading and a top may be near. A lower low in price set against a higher low in the DeM points the other way, towards a bottom.
- Confirm the signal against support and resistance or a candlestick pattern before you enter, so you are not trading the oscillator on its own.
- Take the stop from the chart, placing it beyond the recent swing rather than at a fixed distance, and size the position to that stop.
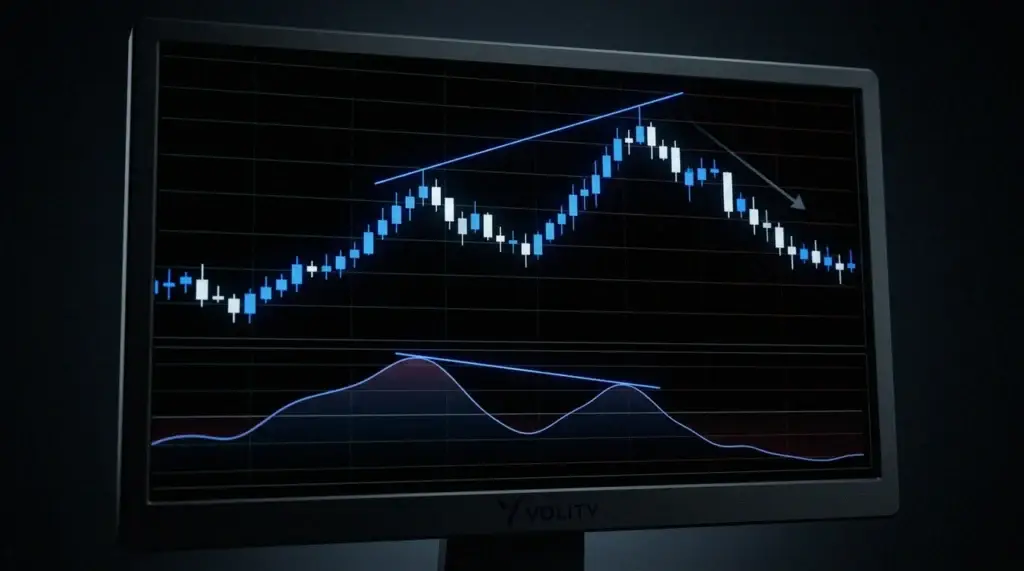
Divergence is where the DeMarker earns its keep, so it is worth a slower look. In a healthy uptrend, price and the DeM push to higher highs together because demand keeps building underneath. When price prints a fresh high but the DeMarker prints a lower one, that new high arrived on weaker demand than the last, which is often the first hint of a divergence and a trend short of buyers. The opposite reading, known as hidden divergence, points to trend continuation instead, so it pays to know which one you are looking at.
DeMarker vs RSI and stochastics: how does it compare?
The DeMarker sits in the same family as the Relative Strength Index and the stochastic oscillator. All are bounded momentum tools that flag overbought and oversold conditions. What separates the DeM is its focus on the relationship between consecutive highs and lows rather than closes, so it can react a little differently to intrabar strength and weakness. A related cousin is the awesome oscillator, which reads momentum through the gap between two moving averages.
No single oscillator beats the rest. Plenty of traders run the DeMarker next to the RSI on their chosen markets and keep whichever one suits their eye. The lesson that holds across all of them is the same: momentum oscillators are exhaustion and divergence tools, best used to time entries within a trend or range rather than to call the direction of the trend itself. That is the point the CMT Association stresses in its curriculum on momentum, and it is the reason the DeM is read alongside price rather than instead of it.
Using the DeMarker on Volity
The DeMarker is a standard indicator on the Volity MT platform, so you can add it to any market in a couple of clicks, change the lookback period, and read exhaustion and divergence straight off charts powered by TradingView. Once a setup lines up, you can trade forex, indices, gold or crypto through contracts for difference from one account. Spreads start from 0.6 pips, 99.6% of orders fill in under a second, and execution is regulated by CySEC through UBK Markets (licence 186/12).
Because reversal signals from an oscillator can fire early, keep the risk defined: set a stop beyond the recent swing and size the position to it. Use leverage with care too. Volity offers up to 1:500 (product-dependent) with negative balance protection. These are leveraged products that magnify losses as well as gains, so treat the ceiling as a capability rather than a setting to reach for, and size every position to the stop. It costs nothing to open an account, you can invest from as little as $1 and start trading from $1, and a free demo lets you practise reading the DeMarker until the divergence signals feel natural before you commit real money. Check the full cost of trading on the charges and fees page first.
Related patterns
Frequently asked questions
What does the DeMarker indicator measure?
The DeMarker measures demand by comparing each bar’s high and low with the previous bar’s. It gauges whether buying or selling pressure is becoming exhausted and plots a value between 0 and 1, which flags overbought and oversold conditions on the chart.
What are the standard DeMarker levels?
The usual thresholds are 0.7 for overbought and 0.3 for oversold, with the middle band treated as neutral. Some platforms rescale the indicator to run from 0 to 100, placing the same levels at 70 and 30, but the meaning is identical.
Is the DeMarker better than the RSI?
Neither is strictly better. Both are bounded momentum oscillators, but the DeMarker works from the highs and lows of each bar while the RSI works from closing prices. Test both on the markets you trade and keep the one whose signals fit your style.
Can the DeMarker be used in a trend?
Yes, though it takes care. In a strong trend the DeMarker can stay overbought or oversold for a long time, so lean on divergence signals and price confirmation rather than fading every extreme reading, which can put you on the wrong side of a running move.