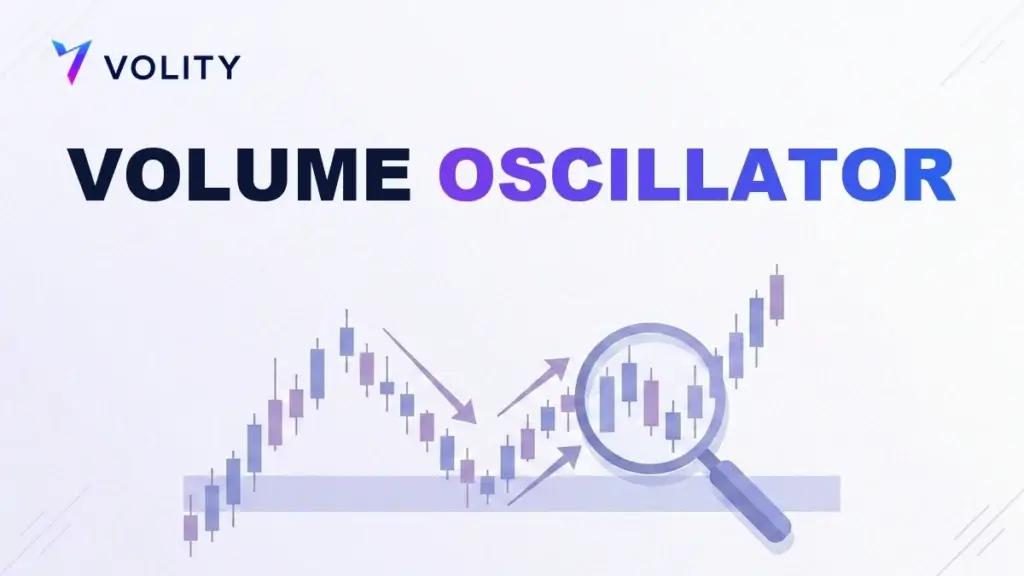
The volume oscillator measures the momentum of trading volume. It compares a fast and a slow moving average of volume and plots the gap between the two. When the fast average sits above the slow one the reading is positive, so volume is expanding and a move has real participation behind it. When it slips below zero, volume is fading. Traders lean on it to confirm trends and to check that a breakout has genuine backing rather than empty enthusiasm.
What is a volume oscillator?
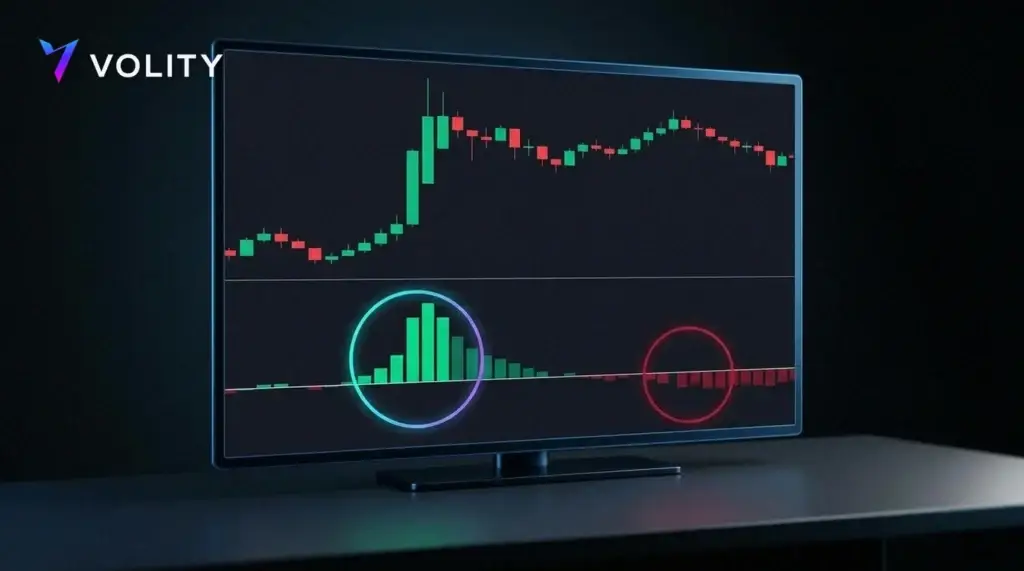
The volume oscillator is a momentum tool built entirely from volume rather than price. It takes two moving averages of the volume figure, a shorter faster one and a longer slower one, and plots the difference between them as a single line that swings above and below zero. In effect it strips volume down to one question: is participation growing or shrinking right now?
This matters because volume is the fuel behind price. A move backed by rising volume has conviction, while a move on falling volume is running on fumes. Raw volume bars are noisy and awkward to compare from one candle to the next, so the oscillator smooths them into a cleaner read of whether the crowd is leaning into a move or drifting away from it. That kind of volume analysis is a staple of the work done by market technicians in the CMT Association body of knowledge.
How is the volume oscillator calculated?
The calculation is simple. Take a fast moving average of volume and a slow moving average of volume, then express the gap between them. Most charting packages state it as a percentage of the slow average so the scale stays consistent from one instrument to the next. The formula is the fast volume average minus the slow volume average, divided by the slow average, multiplied by 100. Plotted that way it is often called the percentage volume oscillator.
The two lookback periods are the only settings you choose. Common pairings are a 5 and a 20, or a 14 and a 28, though 12 and 26 turn up as well, mirroring the periods used on many standard charting platforms. Shorter periods make the oscillator more sensitive and jumpy; longer periods make it smoother and slower to react. There is no single correct pairing, so match the periods to your timeframe and the instrument you trade, then keep them consistent so your readings stay comparable over time.
How do you read the volume oscillator?
Reading the volume oscillator comes down to two things: where it sits relative to zero, and the direction it is heading.
| Volume oscillator | Meaning | Implication |
| Positive and rising | Volume expanding | Move has participation, trend or breakout supported |
| Positive but falling | Volume still high but easing | Momentum may be topping out |
| Negative | Volume contracting | Move lacks fuel, be cautious on continuation |
| Crossing zero upward | Volume turning up | Fresh interest entering the market |
The one thing the volume oscillator will not give you is direction. It measures how much volume is behind a move, not which way price is about to travel. A positive, rising oscillator confirms whatever price is doing, up or down, and it never predicts up or down on its own. That is exactly why the tool is read next to price rather than in isolation, a point worth keeping in mind whether you learned your volume basics from a trading desk or a resource like BabyPips.
How do you trade with the volume oscillator?
The volume oscillator earns its keep as a confirmation tool. Three uses cover most of what traders need from it.
- Confirming a breakout is the first. When price breaks a level, check the oscillator before you trust the move. A breakout on a rising, positive oscillator has real participation and is more likely to hold, while one on a falling or negative oscillator is suspect and prone to failing.
- Gauging trend health is the second. In a healthy trend, volume tends to expand in the direction of the move. An oscillator that stays positive as a trend advances backs it up, whereas one that quietly fades is a warning the trend is tiring.
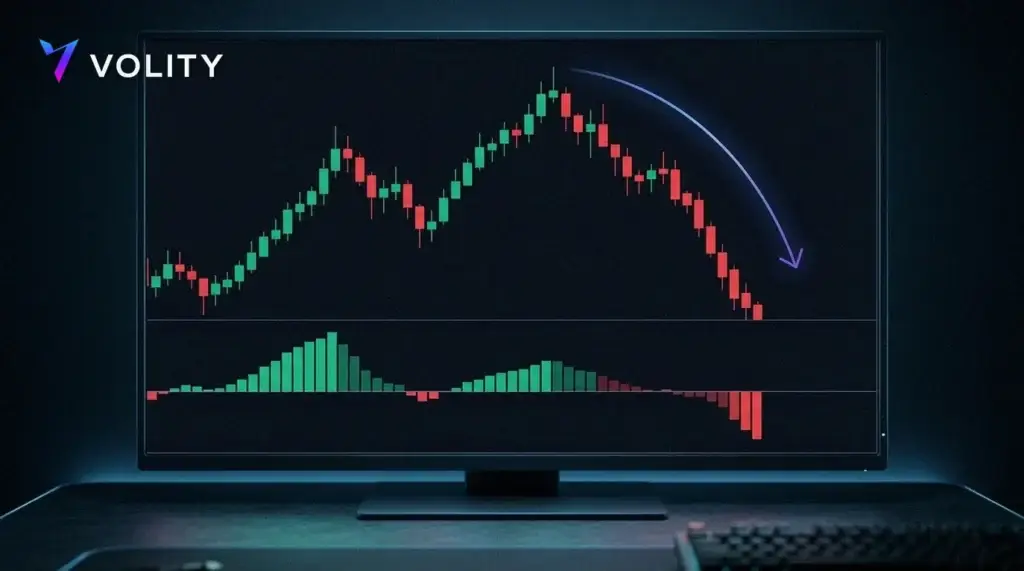
- Spotting divergence is the third. If price makes a new high while the volume oscillator makes a lower high, the move is losing participation, which often flags a stall or reversal before price shows it.
All three uses pair the oscillator with price. You are never trading the volume oscillator on its own; you are using it to grade the quality of a price signal you already have. A breakout, a trend, or a swing high becomes more trustworthy when volume agrees, and more questionable when it does not.
Volume oscillator vs On Balance Volume: what is the difference?
Both are volume-based tools, but they answer different questions. On Balance Volume, or OBV, is a running cumulative total that adds volume on up days and subtracts it on down days. It builds a direction-aware line that tracks whether volume is flowing into or out of an asset over time, which makes it a trend tool with a directional bias baked in.
The volume oscillator is direction-neutral and momentum-focused. It does not care whether days closed up or down; it only measures whether volume is expanding or contracting right now. Plenty of traders run the two together: OBV to read the longer flow of volume, and the volume oscillator to judge the immediate strength behind a specific breakout or swing. If you want to go deeper on the warning signals, our guide to volume divergence covers how thinning participation shows up before price turns.
What are the limits of the volume oscillator?
The biggest limitation is that it gives no directional signal, so it can never be a standalone system. Used alone it will simply tell you volume is high or low, and that is not a trade. It needs a price-based setup to confirm before it adds anything, which is one reason divergence readings are always cross-checked against structure.
Data quality is the other caveat. In decentralised markets such as spot forex there is no single exchange, so the volume your platform shows is tick volume, a count of price updates rather than true traded contracts. Tick volume is a solid proxy and works well for the oscillator, but it is worth knowing what you are actually measuring. On centralised markets and many crypto venues, reported volume is more complete. Either way, treat the volume oscillator as a confirmation lens, not a crystal ball.
Using the volume oscillator on Volity
The volume oscillator is one of the indicators you can plot on the Volity MT platform. Drop it into the sub-panel beneath any chart, set your own fast and slow periods, and use it to confirm breakouts and flag divergence in real time across more than 40 forex pairs, global indices, commodities and crypto. It sits within a wider set of technical indicators you can layer on the same chart, and it fits naturally with two-directional CFD trading, where confirming participation matters whether you are positioning long or short.
Because the oscillator confirms rather than predicts, pair it with a clear price setup and keep the risk defined. Set a stop from structure, size the position to fit it, and treat leverage as a deliberate choice rather than a default. Volity offers leverage of up to 1:500 depending on the product, and that leverage magnifies losses as fast as gains, which is why regulators including the FCA and ESMA place strict limits on how leveraged CFDs are sold to retail traders. Trading execution is regulated by the Cyprus Securities and Exchange Commission through UBK Markets under licence 186/12.
None of this needs a big outlay to learn. Opening an account costs nothing, a free demo mirrors live pricing so you can practise reading volume confirmation risk-free, you can invest from $1, and a live position can start from as little as $1. Confirm the numbers on the charges and fees page before you commit real money, and build the habit of checking what the volume oscillator says before you trust the next breakout.
Frequently asked questions
What does the volume oscillator tell you?
The volume oscillator tells you whether trading volume is expanding or contracting by comparing a fast and a slow moving average of volume. It confirms the strength behind a price move, but it gives no directional signal on its own, so it is always read alongside price.
What are good volume oscillator settings?
Common pairings are a fast and slow period of 5 and 20, or 14 and 28. Shorter periods react faster but are noisier, while longer periods are smoother and slower. Match them to your timeframe and keep them consistent so your readings stay comparable.
Can the volume oscillator confirm a breakout?
Yes, and that is one of its main uses. A breakout accompanied by a rising, positive volume oscillator has genuine participation and is more likely to hold, while a breakout on a falling or negative oscillator lacks fuel and is more prone to failing.
What is volume oscillator divergence?
Divergence occurs when price makes a new high or low but the volume oscillator does not follow, showing the move is losing participation. It is an early warning that a trend may be tiring and could stall or reverse.