Williams %R signals produce frequent false reversals when traded without trend confirmation, which makes standalone entries dangerous for retail accounts. Overbought readings of -20 can persist through entire bull trends without triggering reversals, leaving traders whipsawed by repeated failed sells. In ranging markets, oscillators can trigger chains of false signals that deplete an account before a genuine reversal arrives. Capital at risk.
Williams %R indicator movements identify the relative strength of current prices compared to a defined historical window. This oscillator measures momentum exhaustion by tracking how close a security finishes to its high or low range. Its failure swings are the higher-quality signal: they only fire when price makes a new extreme that momentum does not confirm.
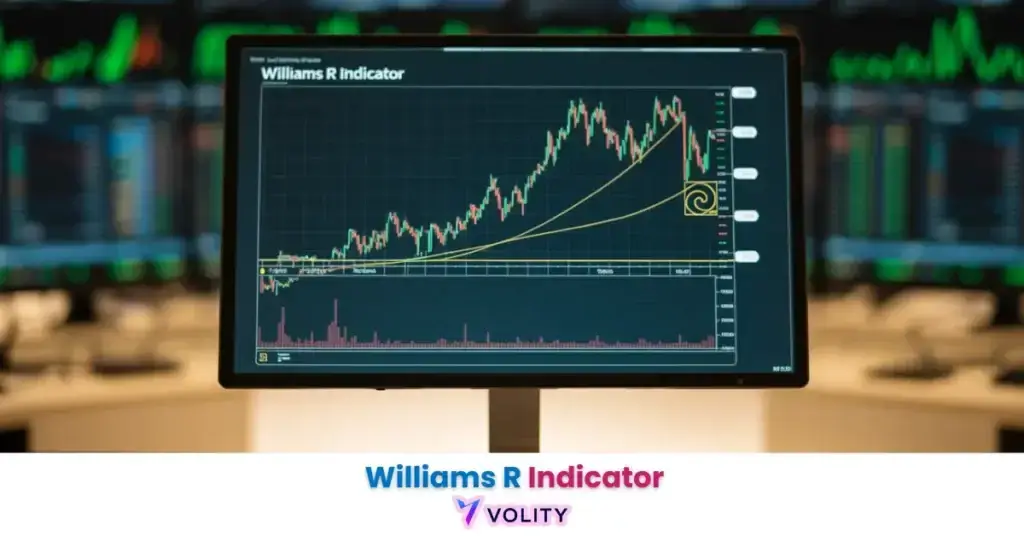
The Williams %R indicator functions as a highly reactive momentum oscillator designed to capture market extremes in real-time. It represents the percentage-based distance between the current close and the period’s highest high, normalized to an inverted scale. It serves as a primary leading indicator for traders seeking to identify potential turning points before they appear in price action.
The 2026 technical landscape emphasizes the need for fast-acting oscillators to navigate increasingly volatile trading sessions. By mastering the Williams %R thresholds and failure-swing patterns, investors can differentiate between standard market noise and genuine shifts in institutional supply and demand. Technical Analysis in Forex provides the foundational framework within which the Williams %R operates as a specialized momentum tool.
While understanding Williams %R Indicator is important, applying that knowledge is where the real growth happens. Create Your Free Forex Trading Account to practice with a free demo account and put your strategy to the test.
What is the Williams %R and how does it work?
The Williams %R is a momentum indicator that measures overbought and oversold levels by comparing a security’s closing price to its high-low range. Larry Williams developed this indicator in the 1970s as a specialized futures trading tool, leveraging the concept that prices trading near their range extremes often signal momentum exhaustion. The oscillator’s unique 0 to -100 negative scale distinguishes it visually from other oscillators while emphasizing the percentage distance from the period’s high point.
The Core Function of Williams %R reveals whether an asset is trading near the top or bottom of its recent trading history, providing traders with a leading signal before price action confirms the reversal. The inverted negative scale was intentionally designed by Larry Williams to differentiate this indicator from competitors and to emphasize the conceptual “rejection” or “distance” from the recent high. Entity references include the Williams %R itself, Larry Williams as the creator, Momentum Oscillators as the broader category, and High-Low Range as the mathematical foundation.
Larry Williams utilized this indicator to win the 1987 World Cup Championship of Futures Trading, turning $10,000 into over $1.1 million in 12 months, validating the indicator’s effectiveness in identifying market extremes. Williams %R reference definition verifies the indicator’s development history and the mathematical mechanics of its inverted -0 to -100 scale. Futures Trading for Beginners explains the foundational concepts that futures traders apply when using momentum oscillators to time entries and exits.
Ready to Elevate Your Trading?
You have the information. Now, get the platform. Join thousands of successful traders who use Volity for its powerful tools, fast execution, and dedicated support.
Create Your Account in Under 3 MinutesUnderstanding the Williams %R formula and lookback periods
The Williams %R formula calculates the current close’s position relative to the highest high and lowest low over a user-defined lookback period. The official formula, %R = ((Highest High – Close) / (Highest High – Lowest Low)) * -100, measures where the current close sits within the range, then inverts the value to produce the -0 to -100 scale. The numerator captures the distance from the close to the high, while the denominator normalizes this distance to the total range span.
Standard Lookback periods use 14 bars as the global benchmark for daily and H4 charts because this timeframe balances responsiveness to recent price moves against unnecessary noise from minor intraday fluctuations. Sensitivity adjustments allow traders to modify this baseline: using 7 periods increases responsiveness for aggressive scalping but generates more false signals, while 28 periods provides smoother trend filtering but may miss fast reversals. Most platforms expose the %R series through an API or a spreadsheet export, which is what makes it practical to backtest a lookback setting across thousands of historical bars rather than eyeballing it.
Moving Average Analysis details the comparative strengths of simple versus smoothed approaches that inform oscillator design. MetaTrader 5 Help: Williams’ Percent Range verifies the exact calculation formula and confirms the 14-period standard as the universal default across professional trading platforms.
Identifying overbought and oversold zones (Thresholds)
Threshold measurements at -20 and -80 identifies the primary market conditions where price momentum is likely to become exhausted. The Overbought Zone exists between readings of 0 and -20, where the current close sits very near the recent session highs, indicating that buyers have driven prices aggressively higher and may face exhaustion. The Oversold Zone occurs when the indicator falls between -80 and -100, showing that the close sits near the recent session lows and that sellers have exhausted their momentum.
The “Indecision Zone” between -20 and -80 carries no extreme signal, representing the range where neither buyers nor sellers have achieved dominance. Readings in this zone frequently indicate consolidation or balanced two-way trade, making them less reliable for standalone reversal signals. The textbook shape, as an illustration of the rule rather than a record of a specific trade: in an established uptrend, price pulls back and Williams %R falls deep into oversold territory below -90. The next bar crosses back above -80, which is the signal that the oversold condition is resolving rather than deepening. A trader taking that cross is joining the existing trend after a pullback, not calling a reversal, and that distinction is what separates the higher-probability version of this trade from the lower one. Past performance is not indicative of future results.
Interpreting Buy and Sell signals: Reversals and Failure Swings
Oscillator signal interpretation determines the timing of market entries and exits based on threshold crosses and price discrepancies. Basic Cross Signals trigger buys when the Williams %R rises above the -80 oversold threshold, signaling that the pullback has ended and buyers are returning. Sell signals occur when the indicator falls below the -20 overbought threshold, suggesting that the rally has peaked and sellers are asserting control.
Failure Swings represent advanced signals where price makes a new high but the Williams %R fails to reach the -20 zone, indicating hidden weakness in the current trend. This discrepancy signals that while buyers achieved a higher high in price, they failed to generate the same momentum intensity as the prior high, a leading warning that trend exhaustion is approaching. Bullish and Bearish Divergence patterns emerge when price creates a lower low but the indicator creates a higher low, or vice versa, revealing that momentum is not aligned with price direction.
| Feature | Williams %R | Relative Strength Index (RSI) | Stochastic Oscillator |
| Calculation | Close vs. High-Low Range | Avg. Gains vs. Avg. Losses | Close vs. Recent Range |
| Scale Range | 0 to -100 (Inverted) | 0 to 100 | 0 to 100 |
| Overbought Level | -20 | 70 | 80 |
| Oversold Level | -80 | 30 | 20 |
| Signal Speed | High (Reactive) | Moderate (Smoothed) | Moderate-High |
Scale and threshold conventions in the table follow the Williams %R and Relative Strength Index reference definitions.
The Stochastic oscillator reference definition sets out the Fast %K calculation that Williams %R mirrors, which is the cleanest way to confirm the relationship between the two.
Williams %R vs. RSI vs. Stochastic Oscillator
Comparative oscillator analysis identifies the technical trade-offs between reactive price-range metrics and smoothed momentum calculations. Williams %R exhibits superior speed in identifying short-term peaks compared to the RSI because it directly measures price position within the range, reacting instantly to new highs or lows. The RSI smooths momentum calculations using average gains versus losses, requiring a 14-bar history before it can respond to price extremes, creating inherent lag compared to the more reactive Williams %R.
The mathematical link between Williams %R and Stochastics runs deep, the Williams %R is mathematically a mirror image of the Stochastic Fast %K, with the primary difference being the inverted 0 to -100 scale that Larry Williams designed to emphasize the “rejection” of price highs (mathematically equivalent but conceptually inverted). Williams %R should be preferred in high-volatility ranging markets where rapid reversals occur frequently and where momentum exhaustion signals lead price action by minutes or hours. Stochastic Indicator Guide details the similarities and differences between these two closely related oscillators. Relative Strength Index RSI Guide provides the comparative framework for understanding when RSI’s smoother approach adds value over the Williams %R’s reactive nature.
Turn Knowledge into Profit
You have done the reading, now it is time to act. The best way to learn is by doing. Open a free, no-risk demo account and practice your strategy with virtual funds today.
Open a Free Demo AccountFiltering false signals in the 2026 market
Strategic confluence protocols determines the validity of oscillator signals by requiring secondary confirmation from price action or volume. Using Moving Averages as regime filters ensures that traders only take -80 buy crosses when the 50 SMA is rising, confirming that the intermediate trend remains bullish. Candlestick Confirmation involves looking for Hammers or Engulfing bars at %R extremes, validating that the oscillator’s signal is backed by concrete price-rejection candlestick patterns.
Volume Divergence serves as a critical filter, if a -80 oversold cross occurs on low volume, institutional participation may be absent, suggesting that the reversal is only temporary. What is MACD provides an alternative momentum oscillator that can be paired with Williams %R to confirm directional strength. Forex Risk Management Strategies emphasizes position sizing discipline when trading oscillator signals to ensure that inevitable false signals deplete accounts slowly rather than catastrophically. Candlestick Pattern Trading details how to synchronize candlestick confirmation with technical oscillators to improve entry probability.
Key Takeaways
- Williams %R is a leading momentum indicator that measures a security’s closing price relative to its high-low range over a specified period.
- Overbought readings occur when the indicator rises above -20, signaling that the price is near the top of its recent trading range.
- Oversold readings occur when the indicator falls below -80, indicating that the price is near the bottom of its recent trading range.
- Signal crosses involving the -20 and -80 levels serve as potential entry and exit triggers when confirmed by the prevailing market trend.
- Failure swings represent advanced signals where the indicator fails to reach its extreme thresholds, often identifying hidden trend weakness.
- Market context such as regime identification with moving averages is essential for filtering out the frequent false signals generated in trending markets.
Frequently Asked Questions
For a smoother, range-based momentum oscillator that cuts down on false signals, see our guide to the Stochastic Momentum Index.
For a complementary trend-following tool that uses three smoothed moving averages rather than momentum, see our guide to the William Alligator Indicator.
This article contains references to the Williams %R Indicator and Volity, a regulated CFD trading platform. This content is produced for educational purposes only and does not constitute financial advice or a recommendation to buy or sell any financial instrument. Always verify current regulatory status and platform details before using any trading service. Some links in this article may be affiliate links.