A footprint chart is a candlestick that has been opened up to show the volume traded at every price inside the bar, split into buying against selling. Rather than showing only the open, high, low and close, each candle exposes the order flow behind the move, so you can see where aggression was absorbed and whether a push had any real weight behind it. That is the part an ordinary candle keeps hidden.
What is a footprint chart?
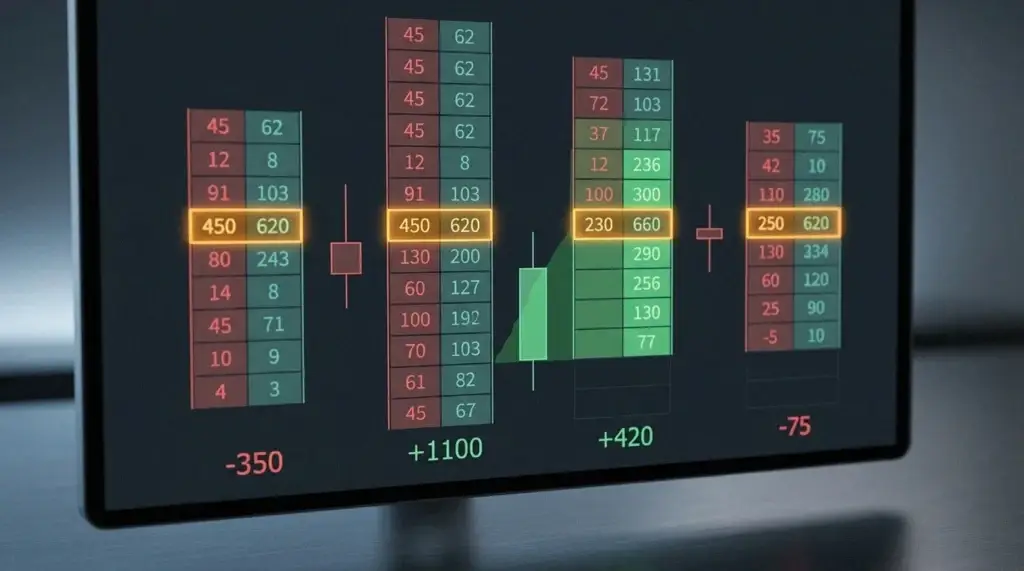
A footprint chart, sometimes called a cluster chart or an order flow chart, swaps the solid body of each candle for a grid of numbers. Every row is a price level, and each row shows how much volume traded there and whether it hit the bid or the ask. A standard candlestick tells you that price went up. A footprint chart tells you how it went up, whether buyers had to pay up into the offer or whether a seller sat there quietly soaking up the buying, and it flags which prices pulled in the most activity. One candle becomes a full record of the auction that happened inside it.
Footprint charts work best on centralised markets such as futures, where every contract traded is reported through one venue and the volume figure is exact. On decentralised markets like spot forex, platforms fall back on tick volume as a proxy. The aim does not change, which is to read the intent behind a move and not only the result it left on the chart.
How does a footprint chart work?
The engine underneath is the bid-ask spread. When an aggressive buyer lifts the offer, that volume is recorded on the ask side; when an aggressive seller hits the bid, it lands on the bid side. A footprint chart tallies both at each price and usually prints them in two columns, bid volume on the left and ask volume on the right. Everything else is worked out from those two columns. The difference between buying and selling volume in a bar is the delta. Whichever price traded the heaviest volume becomes the bar’s point of control. And when one side dwarfs the other at a price, that lopsided row is an imbalance. Read together, they show who was in control at each price, candle by candle.
What can you read on a footprint chart?
- Delta, the net of aggressive buying minus selling in a bar. When price rises while delta falls, the move probably lacks conviction.
- Absorption, where heavy volume hits a level but fails to move price, which usually means a large passive player is providing liquidity and soaking up the aggression.
- Imbalance, a lopsided stack where one side outweighs the other at a price by a wide margin, often near the start of a move.
- Exhaustion, volume drying up at the extreme of a move, a hint that the push is running out of fuel.
- Point of control, the highest-volume price in the bar, a level that price tends to come back to.
What are the main types of footprint chart?
| Type | What each cell shows | Best for |
| Bid/ask footprint | Volume split by bid and ask at each price | Spotting absorption and aggression |
| Delta footprint | Net delta at each price | Seeing where buyers or sellers won |
| Volume footprint | Total volume at each price | Finding high-activity levels fast |
| Profile footprint | A volume profile drawn inside each bar | Reading the shape of the auction |
Most platforms let you switch between these views on the same data. Beginners usually start with the bid/ask view, because absorption and imbalance are the easiest reads there, and add the delta view once the basics click.
How do you trade with a footprint chart?
Order flow is a confirmation tool rather than a crystal ball. Its strongest use is to validate a level you already respect from structure. A simple routine looks like this.
- Mark your key level in advance, whether that is a zone of support and resistance or a higher-timeframe order block.
- When price reaches it, watch the footprint for absorption, meaning heavy volume that keeps failing to break the level.
- Look for delta to flip in your favour, which shows the aggression switching sides.
- Enter as price rejects the level, using the order flow as your trigger instead of a lagging indicator.
- Place the stop beyond the level where the absorption happened, and aim for the next high-volume node.
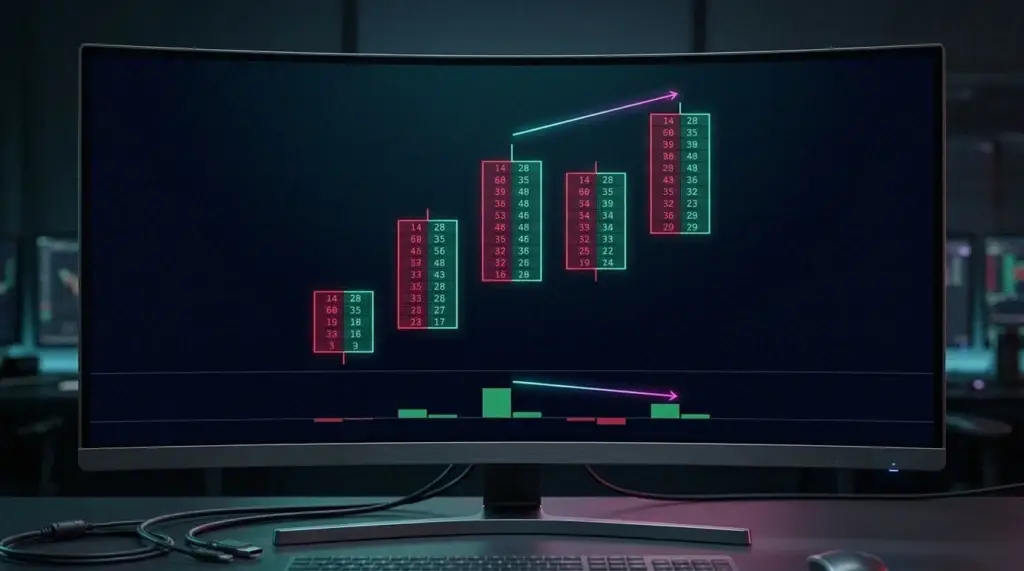
Delta divergence is a second classic setup. Price prints a new high while delta prints a lower high, a sign that fewer aggressive buyers are behind the move. Paired with a resistance level, that divergence gives a high-quality short trigger.
Footprint chart vs candlestick vs volume profile
These three tools answer different questions. A candlestick shows the outcome of a bar. A volume profile shows where volume traded across a whole session or range. A footprint chart zooms all the way in, showing the buy-sell split inside each individual candle. Traders often layer them, using the profile for the big-picture levels and the footprint for moment-by-moment confirmation once price reaches those levels.
How do you read a delta divergence?
Delta divergence is the footprint reader’s favourite reversal signal, and it is worth walking through slowly. Delta measures net aggressive buying minus selling in each bar. In a healthy uptrend, price makes higher highs and delta makes higher highs alongside it, because buyers keep lifting the offer and the move has fuel. A divergence shows up when price prints a new high but delta prints a lower high, which means that fresh high was reached on weaker aggressive buying than the one before. The gap between effort and result warns that the trend is running short of committed buyers. Paired with a resistance level or a higher-timeframe order block, a delta divergence becomes a high-quality short trigger, because you are reading that the pressure behind each push is fading rather than guessing at a top. The mirror image applies at support, where a new price low on shrinking negative delta hints that sellers are wearing themselves out.
Where can you access footprint charts?
Footprint charts live on specialist order-flow platforms. Sierra Chart is a long-standing favourite for footprint and numbers-bars work, with deep customisation and direct market data, and traders searching for “sierra chart footprint” are usually after exactly that depth. A footprint chart on TradingView is available in a lighter form on the paid plans, which suits anyone who wants order flow inside a familiar charting environment. Whichever tool you use to read the flow, you still need somewhere fast and cost-effective to act on what you find. Volity MT gives you TradingView-powered charting and market execution across forex, indices, crypto and commodities, so a setup you spot in the footprint can be traded through contracts for difference from one account. Spreads start from 0.6 pips, 99.6% of orders fill in under a second, and execution is regulated by CySEC through UBK Markets (licence 186/12). Opening an account costs nothing, a demo lets you practise the read risk-free, and a live position can start from as little as $1. Because these are leveraged products that magnify losses as well as gains, the FCA and ESMA place strict limits on how they are sold to retail traders, so check your costs against the published charges and fees before you commit real money.
Frequently asked questions about footprint charts
What is a footprint chart used for?
A footprint chart is used to read the order flow inside each candle, meaning how much was bought and sold at every price and whether a move carried any real conviction behind it. Traders mainly reach for it to confirm entries and exits at levels they already track.
Is a footprint chart good for beginners?
It is an advanced tool. The data is dense, and reading it well takes screen time. Beginners are better served by mastering market structure and support and resistance first, then adding footprint order flow as a confirmation layer once those basics are solid.
Do footprint charts work in forex?
They can, with one caveat. Forex is decentralised, so there is no single official volume figure, and platforms use tick volume as a proxy. Many order-flow traders prefer centralised futures for exact data, then apply the same reads to correlated forex pairs and indices.
What is delta on a footprint chart?
Delta is the net of aggressive buying minus aggressive selling in a bar. Positive delta means buyers lifted the offer more than sellers hit the bid, and negative delta means the reverse. Divergence between price and delta is one of the most closely watched footprint signals.