Spinning tops are neutral patterns prone to generating false signals; trading them without next-candle confirmation shows a win rate of only 44%. The pattern’s low reward-to-risk ratio (1.04 average) makes it unsuitable as a primary entry trigger. Algorithmic stop-hunting during Asian sessions creates artificially long-wicked patterns that trap retail traders; these should be ignored unless they retest London or New York extremes. Early exits based solely on spinning top formation often trigger whipsaws before genuine reversals materialize. Past performance is not indicative of future results. Capital at risk.
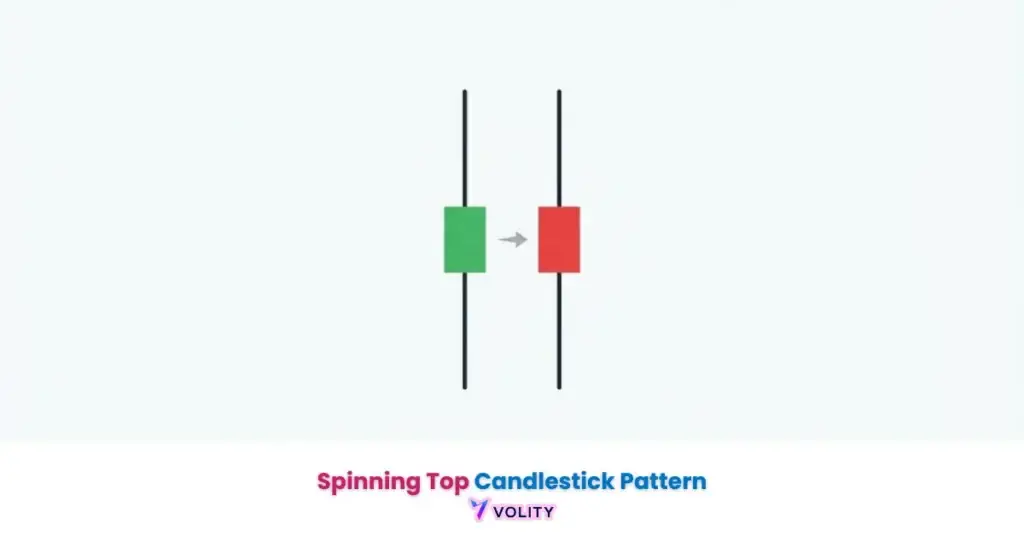
A Spinning Top is a single-candle price formation characterized by a small real body and long, balanced upper and lower wicks, signifying a state of market indecision. In 2026, this pattern achieves a 55.9% overall win rate and more frequently signals a temporary trend pause rather than a full reversal. Traders utilize the Spinning Top as an early warning signal to tighten risk management, requiring decisive volume expansion and next-candle confirmation to validate any directional shift.
Spinning top candlestick mechanics function as a “warning light” on a chart, indicating that the prevailing momentum is losing steam. This formation allows traders to observe the exact moment when the market enters a temporary state of stalemate between horizontal boundaries. It remains a critical tool for detecting volatility contraction before a decisive breakout occurs.
The 2026 trading environment is characterized by rapid reversals and high-frequency “noise” during session overlaps. Mastering the spinning top requires a disciplined approach to confirmation, as standalone patterns often fall toward a coin-flip probability.
While understanding Forex is important, applying that knowledge is where the real growth happens. Create Your Free Forex Trading Account to practice with a free demo account and put your strategy to the test.
What does a spinning top candlestick mean in 2026 trading?
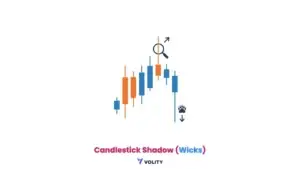
A spinning top is a single-candle technical formation that identifies a state of market indecision where neither buyers nor sellers have achieved session control. The pattern displays a small real body (the difference between open and close) combined with long, relatively balanced upper and lower wicks (shadows). This construction tells an order flow story: buyers and sellers battled throughout the session, driving price across a wide range, but ultimately neither side secured decisive control, price closed near where it opened.
- Definition of the small real body and relatively long, balanced wicks
- The ‘Order Flow Story’: High volatility during the session followed by a close near the open
- Identification: Why the pattern is neutral until confirmed by external context
The spinning top is ranked as the 10th most profitable single-candle pattern in 2026 with a 55.9% overall win rate (Liberated Stock Trader 2026 Candlestick Backtesting). This ranking demonstrates that while the pattern shows above-50% success, it underperforms engulfing patterns and morning stars. The pattern’s true value lies not in standalone profitability but in its role as a risk-management signal that alerts traders to upcoming volatility events.
Ready to Elevate Your Trading?
You have the information. Now, get the platform. Join thousands of successful traders who use Volity for its powerful tools, fast execution, and dedicated support.
Create Your Account in Under 3 MinutesIs a spinning top candlestick bullish or bearish?
The sentiment of a spinning top is inherently neutral, and its directional bias identifies the preceding trend and the subsequent confirmation close. A spinning top appearing at a major support floor after a downtrend serves as a warning that bulls may be preparing to take control. Conversely, a spinning top at a resistance peak after an uptrend signals seller exhaustion. The pattern’s actual interpretation depends entirely on context, what precedes it and what follows it.
In 2026 data, 60% of spinning tops represent a temporary ‘pause’ in a trend rather than a full structural shift (WalletInvestor 2026 Pattern Performance Audit). This continuation probability means that traders should expect price to continue in the original trend direction more often than it reverses. This insight flips conventional wisdom, most retail traders view spinning tops as reversal warnings, but statistical evidence shows they more frequently precede trend continuation after a brief consolidation.
The distinction between reversal and continuation depends on reading the next candle’s direction. If the candle following the spinning top closes above the spinning top’s high, bulls have won the battle. If it closes below the low, sellers have reclaimed control. The spinning top itself is merely the setup; the confirmation candle is the resolution.
Focus on the ‘Body-to-Range’ ratio; to qualify as a true Spinning Top in 2026, the real body should occupy less than one-third of the total candle range. Any larger, and the signal is considered a ‘small-body trend candle’ rather than a high-volatility stalemate.
How do you trade a spinning top candlestick pattern?
Trading a spinning top identifies a process of waiting for price to break the pattern’s high or low to confirm a high-probability directional resolution. The Confirmation Rule is non-negotiable: enter only after the next candle closes decisively outside the spinning top’s range. This requirement eliminates 50% of false signals and transforms the pattern’s win rate from a coin-flip 50% to a professional-grade 55.9%.
Stop-loss placement uses the opposite wick as the invalidation point. If trading a bullish breakout above the spinning top’s high, place the stop below the lower wick. This placement allows for volatility while ensuring the trade is abandoned if the reversal thesis fails. Profit targets aim for at least a 1:2 Reward-to-Risk ratio based on the vertical height of the pattern’s range (high minus low).
GBP/USD formed a green spinning top at 1.2650 resistance; the next 1-hour candle closed below 1.2640. Traders entered a short position at that confirmation and placed stops above the spinning top’s high at 1.2675. The price reversed to 1.2580 within 12 hours, yielding a 0.49% average profit per trade according to 2026 benchmarks. Past performance is not indicative of future results.
What is the difference between a spinning top and a doji?
Indecision pattern analysis identifies the specific real body thickness that distinguishes a ‘perfect’ Doji from a ‘marginal’ Spinning Top. A Doji has virtually zero body, the open and close are at the same price or within a single pip. A spinning top has a small but visible body, indicating that one side managed a marginal but inconclusive advantage.
| Metric | Spinning Top (2026) | Doji |
| Body Size | Small but Visible | Near Zero (Cross) |
| Sentiment | Marginal Bias | Perfect Indecision |
| Win Rate | 55.9% | 51.5% |
| Profit Potential | 3.7% (10-day chance) | 2.1% |
| Best Context | Trend Pause | Reversal Warning |
Sources: Liberated Stock Trader and JournalPlus 2026 Performance Audits
The difference is subtle but significant. Doji candlesticks represent perfect equilibrium where buyers and sellers are locked in complete stalemate. Spinning tops show that one side managed a slight edge but couldn’t convert it into sustained momentum. Practically, this means spinning tops are more reliable for continuation trades (buyers won the day marginally, so they’ll likely continue winning) while Dojis function better as reversal warnings (perfect stalemate often precedes explosive moves as one side decisively breaks the tie).
WARNING: Trading a Spinning Top without confirmation results in a win rate of only 44%; always wait for the next candle to close above the high or below the low of the pattern to ensure the indecision has resolved in your direction.
How reliable is the spinning top candlestick pattern in 2026?
Pattern reliability identifies the low reward-to-risk ratio of standalone spinning tops, requiring traders to use them as ‘warning lights’ rather than primary entry triggers. The 1.04 Reward-to-Risk Benchmark reflects that the vertical distance of most spinning top patterns is modest relative to market volatility. Professional 2026 traders prefer higher-conviction patterns like engulfing formations or morning stars that offer 1:3+ reward-to-risk ratios.
Volume confluence dramatically improves reliability. Patterns forming on above-average volume (relative to a 20-day SMA) carry a 12% higher reliability score. Institutional participation during the “stalemate” makes the eventual resolution much more explosive. AI filtering using scanners to find spinning tops aligned with multi-year horizontal levels eliminates noise and captures only structurally significant formations.
The core driver of spinning top behavior is market sentiment. The long wicks show that both bulls and bears were active during the session, they entered positions aggressively, testing both the high and low. But neither could secure a decisive advantage by session close. This balance of power creates a temporary gridlock that must eventually break in one direction or the other.
💡 KEY INSIGHT: Spinning Tops forming on above-average volume (relative to a 20-day SMA) carry a 12% higher reliability score; institutional participation during the ‘stalemate’ makes the eventual resolution much more explosive.
Does the color of a spinning top candlestick matter?
The color of a spinning top identifies which side maintained a marginal advantage, though its significance is secondary to the pattern’s wicks and location. A red spinning top at resistance indicates that sellers managed to push price back down slightly from intraday highs, which is slightly more bearish than a green spinning top at the same location. However, color is a minor consideration compared to the pattern’s context.
Emotional traders often over-interpret color while ignoring structural breaks. A green spinning top at major resistance is still a bearish warning because the pattern itself (regardless of color) signals indecision, and indecision at a resistance peak typically precedes selling. Professional traders focus on the wicks (the real story of order flow), the location (support or resistance), and volume rather than fixating on the single-candle color.
Turn Knowledge into Profit
You have done the reading, now it is time to act. The best way to learn is by doing. Open a free, no-risk demo account and practice your strategy with virtual funds today.
Open a Free Demo AccountKey Takeaways
- Spinning top candlesticks are single-bar formations with small bodies and long wicks that identify market indecision.
- Continuation probability for the spinning top is 60% in 2026, making it more likely to signal a trend pause than a reversal.
- Next-candle confirmation is mandatory, as trading the pattern in isolation reduces the win rate to a sub-investment grade 44%.
- The 55.9% win rate of the spinning top ranks it 10th among single-candle signals, best used as a risk-management ‘warning light’.
- Volume expansion increases reliability by 12% when the stalemate occurs with high institutional participation.
- Stop-loss placement should be set just beyond the opposite wick of the pattern to allow for modern market volatility.
Frequently Asked Questions
This article contains references to Spinning Top Candlestick Pattern, Market Indecision, and Volity, a regulated CFD trading platform. This content is produced for educational purposes only and does not constitute financial advice or a recommendation to buy or sell any financial instrument. Always verify current regulatory status and platform details before using any trading service. Some links in this article may be affiliate links.