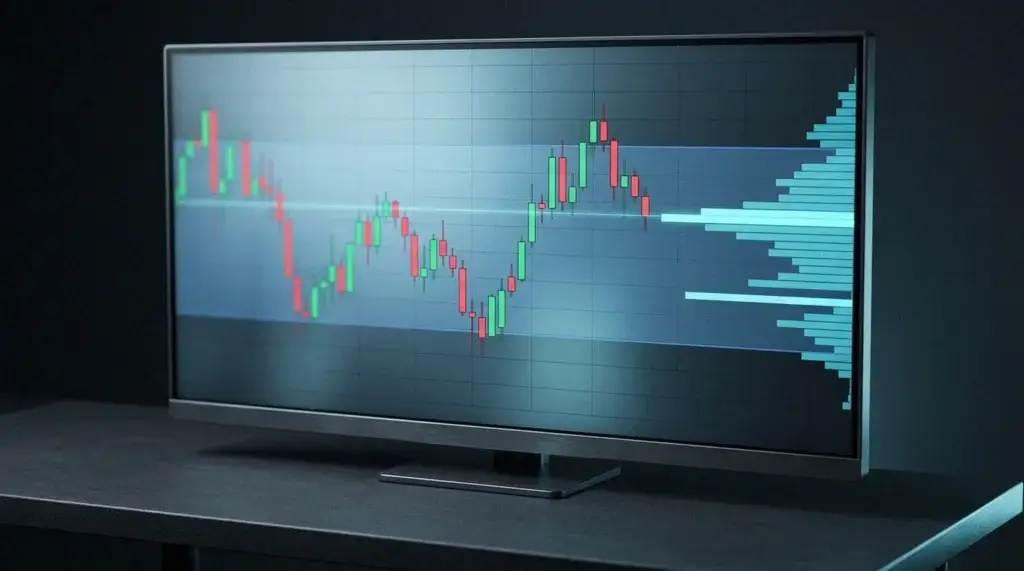
Volume profile is a charting tool that plots how much volume traded at each price over a chosen period, drawn as a horizontal histogram down the side of the chart. The widest bar is the point of control, the price where the most business changed hands, and it works as a magnet that price keeps drifting back toward, as well as a natural support and resistance zone.
What is volume profile?
Most charts show volume along the bottom, as bars under each candle, telling you how much traded in each slice of time. The volume profile indicator turns that on its side and shows how much traded at each price instead. The result is a horizontal histogram: long bars mark prices that pulled in heavy trading, short bars mark prices the market slipped past in a hurry. That difference matters. Prices with heavy volume tend to be fair-value areas where both sides were happy to deal, while thin prices are levels the market rejected. Reading a chart this way pulls your eye from time across to price, which is where support and resistance actually sit.
What are the key parts of a volume profile?
A volume profile has four parts worth knowing by name.
- The point of control (POC) is the price with the highest traded volume in the profile. It is the period’s fairest price and the strongest magnet on the chart.
- The value area (VA) is the band that holds roughly 70% of the volume, marked off by the value area high (VAH) and the value area low (VAL).
- High volume nodes (HVN) are price clusters with heavy volume, where price tends to slow down and consolidate.
- Low volume nodes (LVN) are thin, low-liquidity zones the market crossed quickly, and it usually crosses them quickly again.
What are the types of volume profile?
The tool comes in a few forms, and picking the right one is half the skill.
- Session volume profile builds a fresh profile for each session or trading day, which suits intraday levels.
- Visible range volume profile builds from whatever is on your screen and redraws as you scroll and zoom.
- Fixed range volume profile is one you draw by hand over a move or range you choose, ideal for studying a single rally, gap or consolidation on its own.
The fixed range version is the most precise of the three. Drop it over one rally and you can read the exact price that anchored the move, which often becomes the level to defend on the next pullback.
How do you trade with volume profile?
Trading with volume profile comes down to two habits of price: it gets pulled toward the point of control and high volume nodes, and it speeds up through low volume nodes. A routine you can repeat:
- Draw the profile that fits your question: session for intraday, or a fixed range over the move you care about.
- Mark the point of control, value area high and value area low as your key levels.
- In a balanced market, fade the edges of the value area, watching for a reaction at the VAH or VAL back toward the POC.
- When price leaves the value area on real strength, trade the breakout toward the next high volume node.
- Expect quick travel across low volume nodes, and set targets at the next heavy node rather than in the empty space.
- Put stops beyond the node that anchored your entry, and manage the trade as price nears the next magnet.
Why is the point of control so important?
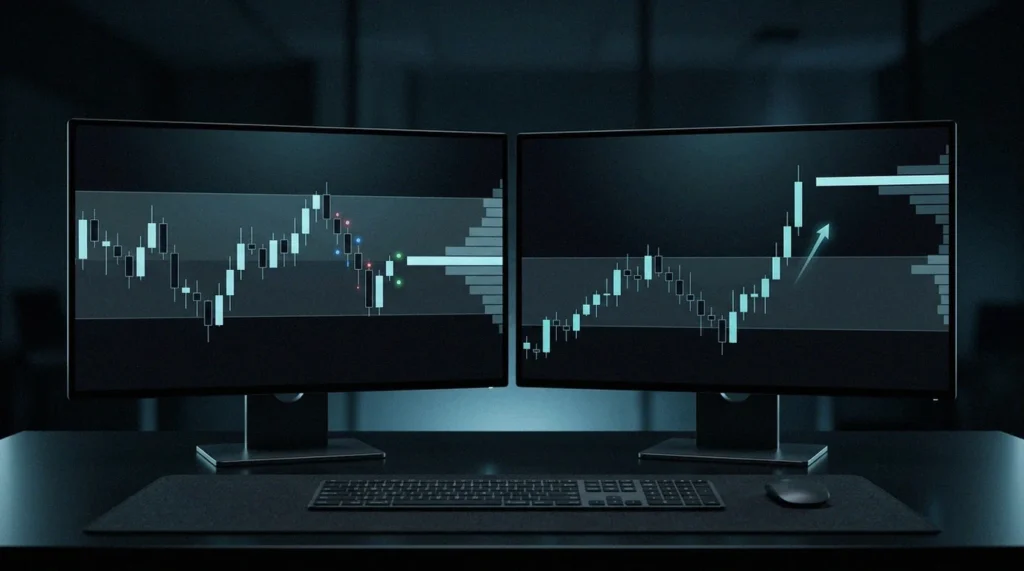
The point of control is the single most-traded price in the profile, so it stands in for the market’s agreed fair value over that period, the same idea that sits behind market profile work. When price trades away from the POC and then runs out of steam, it often comes back to it, which makes the POC both a target and a decision point. A POC that holds on a pullback backs the trend already running, while a decisive break through it warns that fair value is on the move. Naked points of control, the prior-session POCs price has not yet returned to, get watched closely, because they mark unfinished business the market tends to come back and settle.
Volume profile vs volume indicator vs market profile
| Tool | Measures | Best for |
| Volume profile | Volume at each price | Finding fair value, POC and value areas |
| Standard volume | Volume at each time | Confirming momentum behind a candle |
| Market profile | Time spent at each price (TPO) | Reading how long the market accepted a price |
Volume profile and market profile are close cousins: one counts volume at each price, the other counts time at each price. Plenty of traders read them side by side, since a price that drew both heavy volume and a lot of time is a very strong level.
What is the 80% rule in volume profile?
The 80% rule is a classic value-area setup borrowed from market profile, and it pairs naturally with the point of control. It says that when price opens outside the prior period’s value area and then trades back inside it, holding there for two consecutive periods, there is roughly an 80% chance it travels across to the far side. The logic is acceptance: once the market re-accepts prices it had rejected, it tends to rotate through the whole fair-value zone rather than stall halfway. To trade it, mark yesterday’s value area high, value area low and point of control, watch where today opens against them, and if price re-enters and holds inside the value area, aim for the opposite edge with a stop back outside. It is a probabilistic edge rather than a guarantee, but it gives you a clean, rule-based way to trade rotations, with the point of control acting as the magnet in the middle of the move.
Where can you find the volume profile indicator?
The volume profile on TradingView is one of the most widely used versions, with session, visible range and fixed range tools on the paid plans, which is why so many people search for “tradingview volume profile” the first time they meet it. Because Volity MT runs on TradingView-powered charting, you can read those same volume profile levels and act on them in one place, trading the setups through contracts for difference across forex, indices, crypto and commodities. Spreads start from 0.6 pips, 99.6% of orders fill in under a second, and leverage runs up to 1:500 on selected forex pairs, 1:100 on commodities and 1:50 on crypto, all regulated by CySEC through UBK Markets under licence 186/12.
Leverage cuts both ways, so treat volume profile as a way to place better trades, not bigger ones. Because leveraged CFDs magnify losses as well as gains, regulators including the FCA and ESMA restrict how they are sold to retail traders, and it pays to cap the risk on every position. Confirm your costs against the published charges and fees, and rehearse volume profile trading on a free demo before you risk real capital.
Volume profile FAQ
What is the point of control in volume profile?
The point of control is the price level with the most traded volume in a volume profile. It stands for the period’s fairest price and behaves like a magnet: when price drifts off and stalls, it tends to come back to the point of control, which makes it a key level for entries, targets and stops.
Is volume profile a good indicator?
It is a strong context tool, because it shows where real business actually happened rather than lagging behind price the way many indicators do. It works best next to market structure, technical analysis and support and resistance, and it is weakest traded on its own. Like any tool it shifts the odds in your favour without removing the risk.
What is the difference between fixed range and session volume profile?
A session volume profile builds automatically for each trading day or session. A fixed range volume profile is one you draw by hand over a move or period you pick, which lets you study a single rally, sell-off or consolidation on its own and find the exact price that anchored it.
Does volume profile work in forex?
Yes, with one caveat about the data. Forex is decentralised, so platforms build the profile from tick volume rather than one official figure. The levels are still useful, because they show where activity clustered, and many traders cross-check them against correlated futures for confirmation.