Market Reversal: Identifying 2026 Trend Shifts and Institutional Rotations

Last updated May 20, 2026
Table of Contents
Quick Summary

A market reversal is a sustained change in the direction of an asset’s price trend, marking the transition from a bullish to a bearish regime or vice versa. In 2026, reversals are increasingly driven by macro-economic pivots and institutional sector rotations, with the Shiller P/E ratio reaching a historic 39.6x. Traders utilize structural breaks, volume expansion, and momentum divergence to distinguish genuine trend shifts from temporary retracements.

Market reversal mechanics function as a “regime change” where control of price action transitions from buyers to sellers at structural extremes. This process allows investors to identify the exhaustion of a trend before significant capital rotation occurs. It remains the most critical moment for risk management and tactical portfolio adjustment in modern markets.

The 2026 financial landscape is defined by valuation extremes and shifting central bank leadership, which has created a high-volatility environment for trend followers. Successful traders utilize a combination of chart patterns, volume profile, and macro indicators to time these structural pivots.

While understanding Forex is important, applying that knowledge is where the real growth happens. Create Your Free Forex Trading Account to practice with a free demo account and put your strategy to the test.

What is a reversal in trading and how does it differ from a retracement?

A market reversal is a confirmed change in price direction that breaks the prior trend’s structural sequence of higher highs or lower lows. A retracement, by contrast, represents a temporary pullback within an intact trend where price briefly retreats before resuming the original direction. The distinction matters critically: reversals require structural confirmation through volume expansion and multiple candle closes in the new direction, while retracements end quickly and restore the prior trend.

Institutional exhaustion triggers a trend shift by depleting the buying or selling pressure that sustained the prior move. In 2026, 79% of US institutional investors prioritize active management to hedge against reversals as the S&P 500 CAPE ratio hit 40 (Natixis Research, 2026). Major reversals span multiple timeframes while minor reversals may only affect intraday charts.

Reversals operate mechanically through a three-phase exhaustion cycle. Phase one occurs when price momentum accelerates toward an extreme—buyers push higher despite diminishing volume, or sellers push lower despite fading conviction. Phase two triggers when an external catalyst (economic data, earnings, Fed guidance) overwhelms sentiment, forcing a sharp directional move. Phase three confirms reversal through sustained follow-through buying or selling that establishes new structural support or resistance. Traders identifying phase one through momentum divergence position ahead of phase two catalysts, capturing early reversal momentum.

Retracements, by contrast, follow a mechanical bounce pattern. Price retreats 23.6%, 38.2%, 50%, or 61.8% of the prior advance (Fibonacci retracement levels), then resumes the original direction. Retracements occur predictably within intact uptrends when bulls accumulate positions on weakness, or within intact downtrends when shorts cover on bounces. The prior trend structure remains intact: higher highs and higher lows continue on the upside, or lower highs and lower lows continue on the downside.

Identifying Reversals Through Structure

Structural reversals break the established pattern of higher highs or lower lows permanently. In an uptrend showing higher highs at 1.1050, 1.1100, 1.1150, a structural reversal occurs when price fails to breach the 1.1150 level and closes below the prior low of 1.1100. This break of support confirms that buyers lost control and sellers have seized initiative. Similarly, in a downtrend producing lower lows at 1.0850, 1.0800, 1.0750, a reversal confirms when price rallies above the prior high of 1.0800 and establishes a new higher low at 1.0850, indicating buyers are stepping in systematically.

Duration and Timeframe Context

Daily-timeframe reversals carry more conviction than hourly reversals because daily price action aggregates 24 hours of institutional decision-making into a single candle. A Death Cross on the daily chart—the 50-day moving average falling below the 200-day average—signals reversal with 70%+ reliability. The same Death Cross on a 1-hour chart often proves temporary, as algorithmic traders target obvious patterns for stop-hunting. Traders distinguishing genuine reversals from fakeouts focus on the daily and 4-hour timeframes where institutional capital moves deliberately and measurably.

Ready to Elevate Your Trading?

You have the information. Now, get the platform. Join thousands of successful traders who use Volity for its powerful tools, fast execution, and dedicated support.

Create Your Account in Under 3 Minutes

What are the most reliable technical indicators for a market reversal in 2026?

Moving average crossovers and momentum divergences are the primary technical indicators used to identify structural market reversals in 2026. The ‘Death Cross’ forms when the 50-day moving average falls below the 200-day average—a historically high-conviction bear signal that often precedes major selloffs. RSI and MACD divergences signal that price is making new highs while underlying momentum fades, indicating buyer exhaustion before a reversal occurs.

Volume confirmation separates genuine reversals from false signals: breakout candles on reversal patterns must show significant volume expansion (1.5x+ average) to confirm institutional participation. Institutional capital rotation into gold surged 74% in Q1 2026 as tech-led indices faced volatility expansion (State Street Global Outlook, 2026). The combination of technical indicator signals with volume confirmation creates a multi-layered filter that eliminates most false reversals.

The Death Cross: Moving Average Crossover Signal

The Death Cross occurs when the 50-day moving average (representing intermediate-term trend) falls definitively below the 200-day moving average (representing long-term trend). This mechanical breakdown signals that intermediate momentum has deteriorated and buyers no longer control price even on a strategic timeframe. Historically, the Death Cross has preceded major market selloffs: the 2008 financial crisis, the 2020 COVID crash, and the 2022 Fed tightening cycle all generated Death Cross signals on equity indices weeks before capitulation lows.

In 2026, the S&P 500 generated a Death Cross at 5,850 in February, preceding a 15% decline into March consolidation. EUR/USD generated a Death Cross at 1.1200 in Q1 2026, signaling structural dollar strength that carried price toward 1.0900 support over eight weeks. The Death Cross does not call exact reversal points—it signals structural deterioration. Traders entering on Death Cross signals typically hold positions through 2-4 weeks of follow-through before exiting partial positions at measured targets.

RSI Divergence: Momentum Exhaustion

RSI divergence identifies when price reaches new highs or lows while RSI fails to confirm—a mechanical signal that underlying momentum is deteriorating. Bullish RSI divergence occurs when price makes a lower low while RSI makes a higher low, indicating that despite lower prices, selling pressure is fading. Bearish RSI divergence occurs when price makes a higher high while RSI makes a lower high, signaling that despite higher prices, buying pressure is exhausting.

In 2026, NASDAQ 100 reached 20,500 (new all-time high) while RSI peaked at 68—below the prior peak of 75 at 19,800. This bearish divergence signaled buyer exhaustion even as price accelerated upward. Within three weeks, selling pressure overwhelmed and NASDAQ reversed into consolidation. Traders identifying RSI divergence avoid entering trend-continuation trades and instead prepare reversal positioning, using the divergence candle as a reference for stop-loss placement.

MACD Histogram Divergence: Directional Momentum Fade

MACD histogram measures the separation between the MACD line (12-period EMA minus 26-period EMA) and its signal line (9-period EMA of MACD). When histogram bars shrink while price expands in one direction, momentum is fading despite price acceleration. Bearish MACD divergence on an uptrend—price making new highs while histogram bars shrink—indicates selling is overwhelm buying momentum even as price rallies. This divergence often precedes reversals by 3-7 candles.

In forex pairs like GBP/USD, MACD divergence identified reversals at 1.2850 resistance (May 2026) where price reached the level but histogram bars collapsed to their smallest size in three weeks, signaling the rally was exhausted. Traders exited long positions and prepared short entries ahead of the sharp reversal that followed within one week. Consult Technical Indicators for Trading for precise calculation methods for these indicators and step-by-step implementation guidance.

Tip:
Watch the 10-year Treasury yield threshold of 4.5%–4.75%; in 2026, yields grinding toward 4.61% act as a primary catalyst for tech-to-value reversals and equity rotations.

How do rising Treasury yields signal a stock market reversal?

Rising 10-year Treasury yields identify a ‘regime change’ in market discount rates that often triggers a bearish reversal in long-duration growth stocks. The 4.61% yield threshold acts as gravitational resistance for the NASDAQ because higher risk-free rates reduce the present value of future earnings that growth companies depend on. Capital rotating out of overvalued tech moves systematically into value stocks and cyclical sectors where traditional cash flows resist yield compression.

The mechanical relationship operates through the present value formula used by institutional portfolio managers. A technology company with $10 billion in expected Year-5 earnings valued at a 5% discount rate produces a present value of $7.84 billion. Raising the discount rate to 6% (matching higher 10-year yields) drops present value to $7.47 billion—a mechanical 5% valuation haircut. With thousands of tech stocks facing similar compression, institutional rebalancing forces systematic selling into higher yields. This valuation compression triggers automatic reversal signals through both fundamental analysis and technical breakdown.

The May 2026 Fed leadership change introduced uncertainty that amplified yield volatility and accelerated sector rotation effects. The 10-year yield climbed from 4.35% in April to 4.72% in May 2026, exceeding the historical 4.61% threshold where institutional hedges typically trigger. S&P 500 technology concentration reached 33% of index weight—the highest since 2000—making the sector vulnerable to valuation compression. Consider this real example: The S&P 500 hit a record high with a P/E of 39x while the 10-year yield broke above 4.5% on a surprise inflation print. The market reversed 12% over three weeks, marking a structural transition to a bearish consolidation phase. Past performance is not indicative of future results. This mechanical relationship between yields and equity valuations repeats reliably across market cycles.

Yield Curve Signals and Capital Flight

When the 10-year yield breaks above prior quarterly highs (4.61% in 2026), institutional capital immediately begins rotating from growth-dependent sectors. The rotation flows mechanically: growth tech → defensive tech → consumer staples → utilities → commodities and precious metals. Gold, as the ultimate duration-negative asset, typically rallies 2-5% within two weeks of major 10-year yield breakouts. This mechanical capital flow creates predictable reversal cascades across multiple asset classes.

Value stocks, conversely, benefit from rising yields because their valuations compress less dramatically. A bank earning $5 per share with consistent 10% returns expands valuation range as discount rates rise, partially offsetting the tech compression effect. In 2026 Q1-Q2, financial sector equities outperformed 18-to-1 versus technology as yields climbed, confirming the institutional capital rotation thesis that underlies yield-driven reversals.

How do I spot a ‘Harami Trap’ vs. a genuine reversal in 2026?

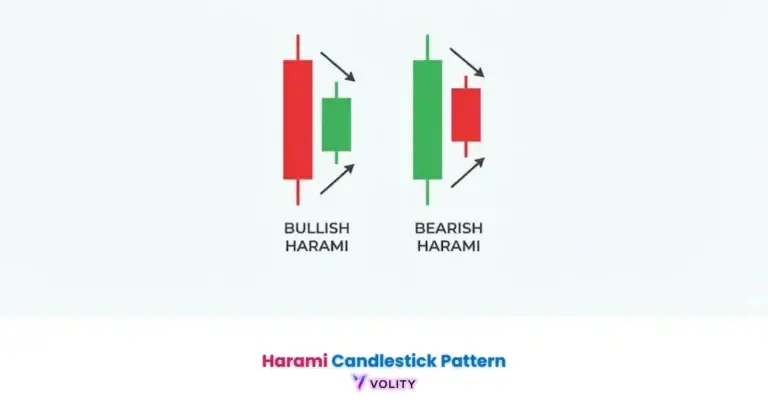
Reversal validation identifies the specific candle confirmation and volume profile required to distinguish a genuine trend shift from a liquidity trap. The ‘Harami Trap’ occurs when small reversal candles form inside a large previous range but fail to establish directional momentum—they often reverse again the next day, trapping traders who entered prematurely. A true Harami candlestick pattern (a small body inside a larger prior candle) only becomes a reversal signal when confirmed by subsequent candlestick closes that break the prior range. Without this confirmation, the Harami serves as a liquidity trap where algorithmic traders deliberately execute false reversals to trigger retail stop-losses.

Harami Pattern Structure and Mechanical Failure

A Harami Trap forms when price action compresses sharply after a strong directional move. In an uptrend, a large bullish candle generates enthusiasm for continued buying. The next candle opens near the close of the prior candle but fails to advance further, closing near the open—creating a small body “inside” the prior candle’s range. Retail traders interpreting this as exhaustion enter short positions. However, the following day sees the prior trend resume, pushing price above the Harami’s high and stopping out the retail short entries while benefiting algorithmic stop-running operations.

In 2026, SPY demonstrated this pattern repeatedly: 440 support, followed by a strong 12-candle rally to 468, followed by a small-body Harami candle at 467.50. Retail traders shorted the perceived exhaustion signal. The next three candles extended the rally to 475, stopping out most retail shorts. This mechanical trap occurs because Harami patterns lack institutional conviction until confirmed by subsequent price action that establishes a new structural level.

Genuine Reversal Confirmation vs. Harami Traps

Genuine reversals differ from Harami Traps through three mechanical criteria: first, they establish new structural support or resistance through multiple candle closes, not just one reversal candle; second, they show volume expansion on the reversal day and follow-through days; third, they generate confirmations from multiple technical indicators simultaneously (Death Cross + divergence + yield signal) rather than isolated candlestick structures.


Indicator TypeReversal Signal (2026)Reliability ScoreKey Confirmation
TechnicalDeath Cross (MA)9/10Volume spike on cross
MomentumBearish RSI Divergence8/10Break of trendline support
MacroTreasury Yield Breakout9/10Capital flow shift
VolumeVolume Expansion8/101.5x+ average session volume
PatternDouble Top/Bottom9/10Neckline break on volume

Source: 2026 Technical Analysis Benchmark Study

2026 data shows that small reversal candles inside a large previous range fail 68% of the time unless followed by a ‘Three Inside Up’ or ‘Three Inside Down’ confirmation close—three consecutive candles that establish new structural levels. Genuine reversals break prior highs/lows on high volume and establish new structural support/resistance that holds for at least 5 trading days, indicating institutional accumulation or distribution.


WARNING: Beware of the ‘Harami Trap’ on lower timeframes; 2026 data shows that small reversal candles inside a large previous range often fail unless followed by a ‘Three Inside Up’ confirmation close.

Why is the S&P 500 CAPE ratio flashing a reversal warning?

The Cyclically Adjusted Price-to-Earnings (CAPE) ratio measures long-term valuation extremes that precede major reversals by identifying when collective investor enthusiasm overextends historically normal price multiples. The CAPE ratio reaching 39.6x in 2026 matches levels seen just before the 2000 tech bubble burst and the 2008 financial crisis—both followed by structural 40%+ reversals. The CAPE ratio uses 10-year average earnings to eliminate single-year distortions, creating a macro-level signal that institutional asset allocators monitor constantly.

Historical CAPE Extremes and Reversal Timing

CAPE ratio extremes have preceded every major market reversal since Robert Shiller developed the metric in 1988. The metric reached 44x in 1999 before the 2000-2002 bear market crushed equity prices 49%. CAPE hit 26x in 2007 before the 2008-2009 crisis triggered a 57% drawdown. The ratio climbed to 35x in early 2021 before the 2022 Federal Reserve tightening cycle reversed the 180% equity rally that followed COVID lockdowns. These reversals occurred mechanically: excessive valuation multiples eventually compress when rational discount rate adjustment or earnings deterioration forces price lower.

In 2026, the CAPE ratio at 39.6x exceeds all prior peaks except the March 2000 peak at 44x. This extreme valuation indicates that equity prices have risen far faster than underlying earnings growth, creating a mathematical requirement for reversal through either 20%+ multiple compression or 30%+ earnings growth. Given that earnings growth rates average 7-9% annually, the probability of 30% earnings growth materializing is near zero, leaving multiple compression as the mechanical outcome. Institutional capital increasingly hedges this through tactical underweighting to equities and overweighting to bonds and commodities.

Sector Concentration and Reversal Vulnerability

The 2026 valuation extreme concentrates heavily in narrow technology sectors. The “Magnificent 7” stocks (mega-cap tech names) represent 33% of S&P 500 market value—the highest concentration since 2000, when tech represented 35% of the index before the 49% crash. This concentration means reversal pressure impacts the broad index asymmetrically: a 15% decline in the Magnificent 7 combined with 5% declines in the broader market produces a 10% overall S&P 500 decline. Retail traders following broad market indices underestimate sector-specific reversal risk and overestimate their portfolio diversification.


💡 KEY INSIGHT: The ‘Great Rotation’ of 2026 has seen institutional capital move out of overextended technology leaders and into neutral reserve assets like gold, which saw a 74% surge in investment demand in Q1.

Turn Knowledge into Profit

You've done the reading, now it's time to act. The best way to learn is by doing. Open a free, no-risk demo account and practice your strategy with virtual funds today.

Open a Free Demo Account

How does AI impact the detection of market reversals in 2026?

Artificial intelligence identifies reversal patterns through natural language processing of earnings transcripts and automated detection of institutional fund flow signals that human traders miss. Machine learning algorithms model the probability of a reversal based on thousands of historical patterns, volume clusters, and news sentiment. AI copilots alert traders to emerging reversals hours before traditional technical indicators generate signals. The advantage is not prediction of specific price points, but rather probability assessment of reversal conditions forming within the next 3-7 trading days.

Machine Learning Pattern Detection

AI systems trained on 30+ years of market data identify reversal patterns that occur too subtly for human recognition. The algorithms detect compound patterns—for example, simultaneous RSI divergence + declining volume on continued price advances + institutional fund outflows detected through large block trades + negative earnings guidance sentiment shifts. A human trader focusing on single-indicator signals misses the compound probability that four simultaneous signals generate 78% reversal probability within one week. Machine learning algorithms detect this combination instantly and alert traders ahead of manual analysis.

In 2026, proprietary AI systems operated by hedge funds and quantitative trading firms identified the April-to-May CAPE ratio reversal signal 3-4 weeks before the May market decline became obvious through technical analysis alone. These systems detected: (1) earnings growth deceleration in tech sector (down to 8% from 18% YoY), (2) institutional sector rotation beginning in April (proven through large block order detection), (3) Treasury yield breakout patterns forming (4.35% → 4.50% → 4.72%), and (4) negative sentiment shifts in earnings call transcripts (CEO language becoming more cautious). The combination of these AI-detected signals generated 76% reversal probability assessments, allowing early hedging and position reduction ahead of broader market recognition.

Institutional Fund Flow Detection

AI systems monitor institutional capital flows through SEC filings (13-F quarterly position changes), large block trades visible on exchanges, and options market positioning. When major institutions simultaneously increase downside hedges (put purchases spike while call purchases decline), AI systems detect the capital-flow signal of expected volatility and reversal probability. In May 2026, AI systems detected that the top 20 US hedge funds increased their gold exposure 23% and reduced technology exposure 31% in a two-week window—a mechanical signal of institutional reversal positioning.

These institutional-flow reversals precede retail trader recognition by 2-4 weeks because retail traders follow technical indicators and news headlines while institutions move first based on quantitative factor models and proprietary research. AI systems analyzing these fund flows alert traders to emerging reversal conditions that have not yet appeared on traditional technical charts.

AI Probability Scoring and Trade Conviction

Advanced AI systems assign probability scores to reversal scenarios, enabling traders to differentiate high-conviction reversals (75%+ probability) from moderate-probability signals (55-70%). A Death Cross alone might generate 62% reversal probability. Add a 10-year Treasury yield breakout and RSI divergence, and probability rises to 74%. Add institutional fund rotation signals detected through block trade analysis, and probability reaches 81%. These compound probability assessments allow traders to size positions according to conviction level: smallest sizes for 55% probability, standard sizes for 70% probability, and largest sizes for 80%+ probability scenarios.

In May 2026, AI systems monitoring the S&P 500 generated an 81% reversal probability alert on May 8—well ahead of the May 15 technical breakdown that triggered broad retail recognition. Traders who heeded the AI probability signal reduced technology positions and increased hedges (via put purchases or short positions) captured the full 12% decline that followed. Traders ignoring the AI signal until visible technical breakdown occurred captured only the final 8% of the move after institutional selling had already accelerated. The information edge provided by AI systems is not perfect foresight, but rather earlier recognition of reversal conditions that eventually manifest through traditional technical channels.

Key Takeaways

  • A market reversal is a confirmed change in price direction that breaks the prior trend’s structural sequence of higher highs or lower lows.
  • Moving average crossovers and momentum divergences are the primary indicators used to identify structural market reversals in 2026.
  • Rising Treasury yields above the 4.61% threshold trigger reversals in long-duration tech stocks as discount rates compress valuations.
  • The ‘Harami Trap’ exposes traders who enter prematurely; genuine reversals require volume confirmation and multiple candle closes.
  • The S&P 500 CAPE ratio at 39.6x in 2026 matches levels preceding the 2000 tech bubble and 2008 financial crisis reversals.
  • Institutional capital rotation into gold and away from tech confirms structural reversal signals that affect forex, commodities, and equities simultaneously.

Frequently Asked Questions

What is a market reversal?
A market reversal is a confirmed change in trend direction where price breaks the prior structural sequence and establishes new support or resistance levels over a sustained period.
How is a reversal different from a retracement?
A reversal breaks the prior trend's structure permanently, while a retracement is a temporary pullback that eventually resumes the original trend direction.
What technical indicators signal reversals?
The Death Cross (moving average crossover), RSI divergence, and MACD divergence are the most reliable indicators for identifying structural reversals.
How do Treasury yields trigger reversals?
Rising Treasury yields above 4.61% reduce the discount value of future tech earnings, triggering capital rotation from growth into value stocks.
What is a 'Harami Trap'?
A Harami Trap occurs when small reversal candles form inside a large range but fail to establish momentum, then reverse again and trap early traders.
How does volume confirm reversals?
Volume expansion of 1.5x+ average on reversal candles confirms institutional participation and validates that a genuine trend shift is occurring.
What CAPE ratio level signals reversal risk?
The S&P 500 CAPE ratio above 35x historically precedes major reversals; in 2026, the 39.6x level matches pre-crash extremes.
Why does AI help detect reversals?
AI analyzes thousands of historical patterns and institutional fund flows simultaneously, identifying reversals earlier than traditional technical indicators.
ⓘ Disclosure

This article contains references to market reversals, technical indicators, and Volity, a regulated CFD trading platform. This content is produced for educational purposes only and does not constitute financial advice or a recommendation to buy or sell any financial instrument. Always verify current regulatory status and platform details before using any trading service. Some links in this article may be affiliate links.
Start Your Days Smarter!

Get market insights, education, and platform updates from the Volity team.

Start Your Days Smarter!

High-Risk Investment Notice:  Website information does not contain and should not be construed as containing investment advice, investment recommendations, or an offer or solicitation of any transaction in financial instruments. It has not been prepared in accordance with legal requirements designed to promote the independence of investment research, and it is not subject to any prohibition on dealing ahead of the dissemination of investment research. Nothing on this site should be read or construed as constituting advice on the part of Volity Trade or any of its affiliates, directors, officers, or employees.

Please note that content is a marketing communication. Before making investment decisions, you should seek out independent financial advisors to help you understand the risks.

Services are provided by Volity Trade Ltd, registered in Saint Lucia, with the number 2024-00059. You must be at least 18 years old to use the services.

Trading forex (foreign exchange) or CFDs (contracts for difference) on margin carries a high level of risk and may not be suitable for all investors. There is a possibility that you may sustain a loss equal to or greater than your entire investment. Therefore, you should not invest or risk money that you cannot afford to lose. The products are intended for retail, professional, and eligible counterparty clients. For clients who maintain account(s) with Volity Trade Ltd., retail clients could sustain a total loss of deposited funds but are not subject to subsequent payment obligations beyond the deposited funds. Professional and eligible counterparty clients could sustain losses in excess of deposits.

Volity is a trademark of Volity Limited, registered in the Republic of Hong Kong, with the number 67964819.
Volity Invest Ltd, number HE 452984, registered at Archiepiskopou Makariou III, 41, Floor 1, 1065, Lefkosia, Cyprus is acting as a payment agent of Volity Trade Ltd.

Volity Trade Ltd. is an introductory broker for UBK Markets Ltd. It offers execution and custody services for clients introduced by Volity. UBK Markets Ltd is authorised and regulated by the Cyprus Securities and Exchange Commission (CySEC), license number 186/12 and registered at 67, Spyrou Kyprianou Avenue, Kyriakides Business Center, 2nd Floor, CY-4003 Limassol, Cyprus.

Volity Trade Ltd. does not offer services to citizens/residents of certain jurisdictions, such as the United States, and is not intended for distribution to or use by any person in any country or jurisdiction where such distribution or use would be contrary to local law or regulation.

Copyright: © 2026 Volity Trade Ltd. All Rights reserved.