Trading pennant patterns and continuation strategies carries substantial risk including the loss of your entire account balance. Breakouts can fail or reverse sharply, triggering stop-loss orders. Slippage during low-liquidity sessions may result in fills far from intended prices. Historical pattern reliability does not guarantee future performance. Capital at risk. Past performance is not indicative of future results.
Pennant patterns are high-conviction continuation signals that identify a temporary pause in a strong market trend. These formations consist of a sharp vertical move followed by a symmetrical triangular consolidation where price range narrows. Thomas Bulkowski’s testing of more than 1,600 pennants puts the break-even failure rate at 54% for both breakout directions, so the pattern earns its keep through the measured move and a tight stop rather than through a high hit rate.
How to trade pennants in forex begins with recognizing the “Flagpole,” which represents a surge of institutional conviction in a specific direction. This initial impulse move sets the stage for a period of equilibrium where buyers and sellers temporarily balance their positions. It provides a standardized framework for anticipating the next leg of a trending market.
The 2026 trading environment requires traders to distinguish between genuine pennant consolidations and deceptive “Fakeout” patterns. Mastering the nuances of this formation enables participants to enter trends with precision and manage their risk-to-reward ratios effectively.
While understanding Forex is important, applying that knowledge is where the real growth happens. Create Your Free Forex Trading Account to practice with a free demo account and put your strategy to the test.
What are pennant patterns and how do they function?
A pennant is a technical chart pattern that identifies a brief consolidation phase following a strong price movement before the original trend resumes. This formation represents a momentary pause where institutional participants accumulate or distribute positions before the next directional impulse.
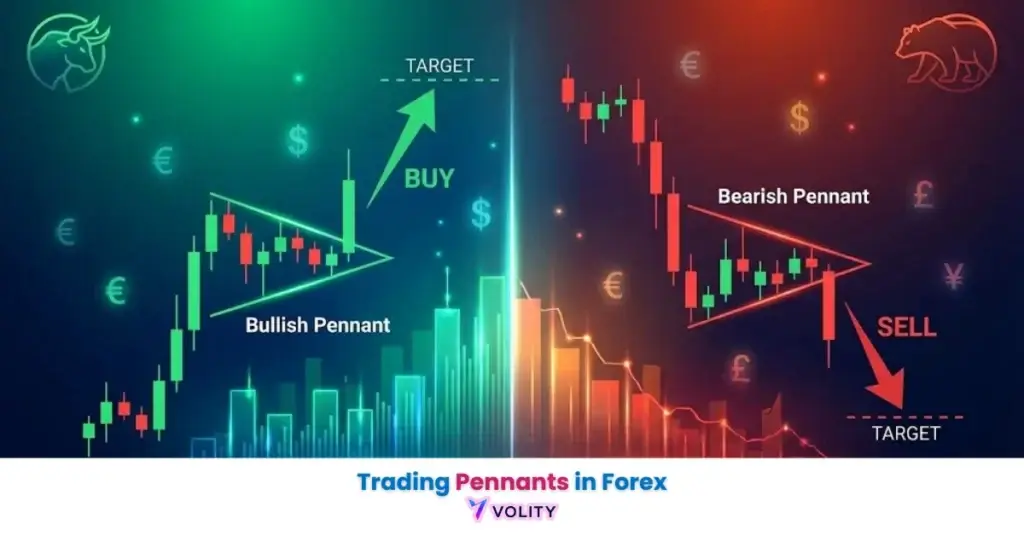
The Flagpole represents the vertical price impulse that precedes the pennant, a sharp, powerful move that establishes market conviction. This move can occur over hours or days and sets the direction for the continuation signal that follows. The Consolidation phase demonstrates how converging trendlines create the triangular “pennant” shape as buyers and sellers negotiate a midpoint before resuming their struggle. Duration is a hard identification rule rather than a guideline: pennants run three weeks or less, and anything longer is a symmetrical triangle or a wedge, not a pennant. They are pauses, not reversals, and an extended consolidation means the trend has lost its original strength.
Pennants are minor trend continuations. Bulkowski measures the average inbound trend at 11 days and the trend after the pennant at 10 days, so the two legs take roughly the same time, but price does not travel as far after the pennant as before it, rising 14% against 19%.
Bullish vs. Bearish Pennants
Pennant classification identifies the direction of the preceding trend, with bullish pennants forming in uptrends and bearish pennants in downtrends. The polarity determines your trading direction entirely.
Identifying the impulse direction requires looking at the flagpole’s direction, not the pennant itself. A bullish pennant forms after an upward flagpole followed by consolidation; breakouts resolve upward toward new highs. Expected breakout bias follows the original trend; bearish pennants form in downtrends and resolve downward. The formation itself (the small triangle) is identical; only the preceding price action determines whether you’re in a bullish or bearish scenario.
Ready to Elevate Your Trading?
You have the information. Now, get the platform. Join thousands of successful traders who use Volity for its powerful tools, fast execution, and dedicated support.
Create Your Account in Under 3 MinutesHow do you identify a valid pennant pattern?
Pattern validation identifies the specific structural requirements, including volume decay and trendline convergence, needed to confirm a pennant. Three objective filters distinguish genuine pennants from random consolidations.
Symmetrical Convergence requires that both the upper and lower trendlines slope toward each other at similar angles, creating an apex. If one trendline is nearly flat while the other slopes dramatically, you’re observing a “wedge” (a reversal pattern) or a “flag” (parallel lines). Volume Profile must show volume decrease during the consolidation and spike on the breakout. Volume decay signals equilibrium as the number of active traders narrows; volume spike on the break confirms new conviction is entering. The Apex represents the critical failure point, if price reaches the very tip of the triangle and bounces off instead of breaking through, you have a potential reversal pattern, not a continuation.
Bulkowski records the volume trend falling through the consolidation 86% of the time and the breakout resolving upward 57% of the time, measured across more than 1,600 patterns (Bulkowski on Pennants). Pennant Chart Pattern provides detailed identification examples.
How to trade pennant breakouts step-by-step
Breakout execution identifies the precise entry point and volume confirmation required to trade a pennant resumption. The mechanical approach separates emotional trading from systematic entries.
Entry Logic follows two opposing strategies depending on the pennant direction. Placing a “Buy Stop” just outside the upper converging trendline on a bullish pennant triggers a market order once price breaks above. Conversely, a “Sell Stop” just outside the lower trendline on a bearish pennant activates on breakout. Confirmation requires waiting for a candle close beyond the pattern rather than trading a “wick” that may retract. The five-minute wick above resistance may lure breakout traders, but the hourly candle close inside the range invalidates the move. The Target Calculation projects the flagpole height from the breakout point, so if the flagpole was 50 pips and the breakout occurs at 1.2850, the target is 1.2900, reached in roughly a third of cases.
Worked illustration of the rule, not a recorded trade: a 50-pip flagpole is followed by a four-hour pennant with volume falling away through the consolidation. Price closes above 1.2850 on expanding volume, so the buy stop triggers. The measured-move target is 1.2900 and the stop sits below the lower trendline. Roughly two trades in three will not reach the full target, which is why the stop has to be tight enough for the ones that do to pay for them. Past performance is not indicative of future results.
Setting Stop Losses and Managing Risk on Pennants
Risk management for pennants identifies the optimal protective levels based on the pattern’s lowest (or highest) consolidation point. The table below summarizes the complete risk management framework.
| Component | Bullish Pennant | Bearish Pennant | Role in the Trade |
| Flagpole | Upward Impulse | Downward Impulse | Trend Power Source |
| Stop Loss | Below Lower Trendline | Above Upper Trendline | Low Risk Exposure |
| Entry | Upper Breakout | Lower Breakout | Momentum Trigger |
| Target | + Flagpole Height | – Flagpole Height | Measured Move |
| Volume | Spike on Break | Spike on Break | Conviction Signal |
The table sets out the mechanics of the pattern. Tested performance figures quoted in this article are Thomas Bulkowski’s, from Bulkowski on Pennants.
Stop loss placement typically sets your protective level just beyond the opposite trendline of the pennant to minimize risk exposure. For bullish pennants, set stops below the lower trendline’s nadir; for bearish pennants, set stops above the upper trendline’s peak. This approach ensures you exit if the pattern reverses into a trap.
Pennants vs. Flags: How to tell the difference
Pattern differentiation identifies the shape of the consolidation phase to distinguish converging pennants from parallel flags. Confusion between these two formation types can lead to incorrect profit targets.
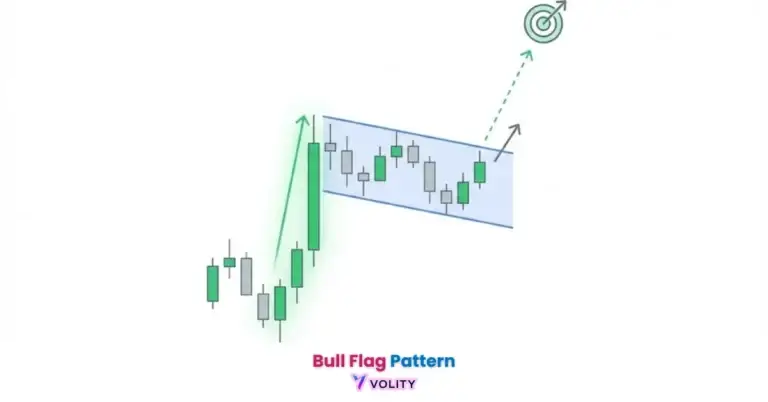
Symmetrical versus Parallel trendlines represent the key distinction. Pennants have converging upper and lower trendlines that narrow toward an apex. Flags have trendlines that slope at similar angles but remain parallel to each other, creating a small parallelogram shape. Reliability comparison shows both patterns are highly reliable, though pennants typically offer better risk-to-reward ratios because the smaller consolidation suggests an imminent breakout. Impact on profit targets remains identical for both patterns, you measure the flagpole height and project from the breakout point. The main practical difference is duration: flags often extend longer than pennants because parallel consolidation allows price to oscillate longer.
Professional traders in 2026 often use the RSI (Relative Strength Index) to ensure the pennant isn’t “overextended” before the breakout occurs. Trend Line provides guidance on drawing accurate trendlines. The flag and pennant patterns reference sets out the shared structure that separates the two shapes.
Turn Knowledge into Profit
You have done the reading, now it is time to act. The best way to learn is by doing. Open a free, no-risk demo account and practice your strategy with virtual funds today.
Open a Free Demo AccountAdvanced Pennants: The “Failed Pennant” Reversal
Failed pennant identification identifies a market reversal that occurs when price breaks out in the opposite direction of the original trend. This scenario transforms a continuation pattern into a reversal setup.
Spotting the “Fakeout” at the apex occurs when price approaches the triangle’s endpoint but reverses sharply in the opposite direction. A bullish pennant that breaks downward through the lower trendline signals trapped buyers and a reversal. Trading the reversal toward the flagpole’s origin means entering opposite the original trend and targeting the starting point of the flagpole as profit.
Risk Management guides proper position sizing for reversal trades.
Key Takeaways
- Pennant patterns are short-term continuation formations that signal a temporary pause in a prevailing market trend.
- The flagpole represents the initial impulse move and provides the mathematical basis for the breakout profit target.
- Consolidation in a pennant is marked by converging trendlines that form a small, symmetrical triangle on the chart.
- Volume profiles should show a clear decay during the pennant formation and a significant spike during the breakout.
- Breakout confirmation requires a candle close outside the pattern to avoid being trapped by false intraday wicks.
- Stop loss placement is typically set just beyond the opposite trendline of the pennant to minimize risk exposure.
Frequently Asked Questions
This article contains references to pennant trading strategies, continuation patterns, and Volity, a regulated CFD trading platform. This content is produced for educational purposes only and does not constitute financial advice or a recommendation to buy or sell any financial instrument. Pennant trading carries elevated risk due to breakout volatility and false signals. Always test strategies on a demo account before committing real capital. Some links in this article may be affiliate links.