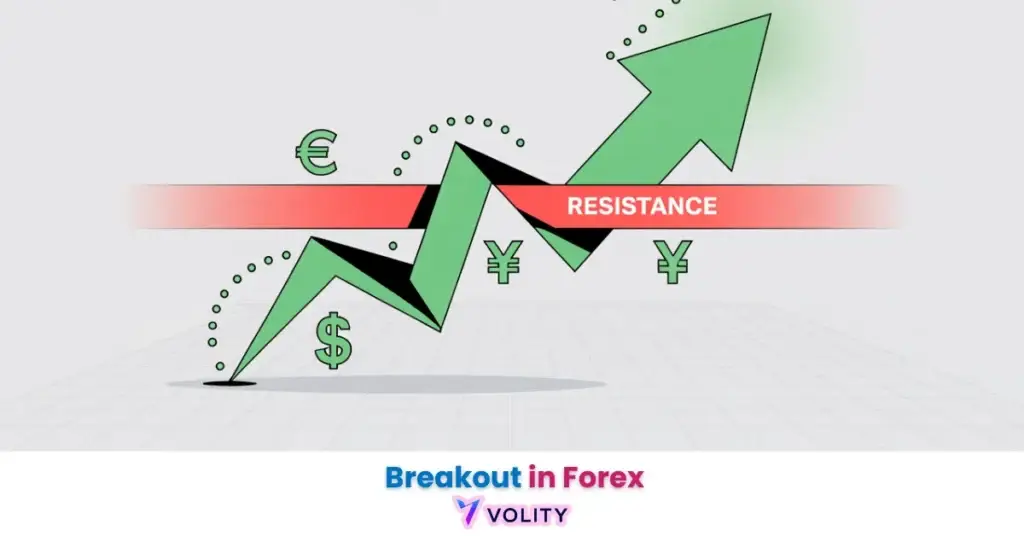
Breakout trading involves executing positions at price levels where high-frequency algorithms dominate volume flow. Automated systems account for a large and growing share of the volume that prints at breakout levels, and fakeout risk is highest on the lowest timeframes. Forex and CFD breakout trading carries extreme leverage risk with margin calls and capital liquidation possible within minutes. Always verify volume confirmation and maintain stops outside liquidity zones. Past performance is not indicative of future results. Capital at risk.
Breakout trading involves executing trades when price moves beyond established support or resistance levels. High-frequency algorithms are heavily represented in breakout volume, which is why a volume filter matters more than the pattern itself. This guide sets out how to separate high-probability breaks from algorithmic liquidity sweeps.
While understanding Breakout Trading is important, applying that knowledge is where the real growth happens. Create Your Free Forex Trading Account to practice with a free demo account and put your strategy to the test.
Breakout trading is a momentum-based strategy that allows traders to execute positions at the inception of new market trends. In the 2026 market, algorithmic trading executes the majority of breakout volume, creating both opportunity and increased fakeout risk. Understanding how to filter high-probability moves from algorithmic liquidity sweeps defines edge in this strategy.
The breakout approach captures the “Animal Spirits” rotations that occur when market sentiment shifts toward specific sectors like Edge AI. Capturing these moves early provides better entry efficiency than trend-following approaches that confirm only after price has moved significantly. The trade-off involves managing higher fakeout risk on lower timeframes where algorithm-to-algorithm interactions create noise.
One of the simplest breakout tools is the Donchian channel, which turns a close above the highest high of the last N bars into a long signal and a close below the lowest low into a short.
Why is Breakout Trading Critical in 2026?
Breakout trading is a momentum-based strategy that allows traders to execute positions at the inception of new market trends. Automated execution now dominates the order flow around obvious levels. The BIS Markets Committee study group on high-frequency trading in the foreign exchange market sets out how that participation behaves in calm and in stressed conditions, and it is why traditional support-resistance analysis now needs algorithmic context to avoid catching fakeouts.
“Animal Spirits” rotations, sudden institutional capital flows into high-conviction sectors, generate some of the cleanest breakout opportunities. Themes such as Edge AI, Critical Minerals and Advanced Logistics tend to see volatility expand around the break. Those sectoral rotations carry a macroeconomic story that can sustain a move well beyond the initial institutional entry.
Execution speed at breakout inception improves entry price efficiency compared with trend-following indicators. A trader entering on the confirmed volume spike captures the opening momentum of the move. A trend-follower waiting for further price confirmation enters later and higher, which compresses the risk-reward ratio.
How Do You Identify High-Probability Breakouts?
Breakouts only matter when they cross clean support and resistance levels; confirm with RSI divergence and proper trend line validation.
High-probability breakouts are price moves that are confirmed by a 150% increase in trading volume relative to the 20-day average. The 150% volume rule operates as the primary filter separating algorithm-driven institutional moves from retail liquidity sweeps. This threshold identifies that sufficient institutional capital has committed to the breakout direction.
Volume Profile analysis reveals “Value Area” exits, the price range where the majority of recent volume clustered. Breakouts that clear above the Value Area with expanding volume show higher continuation probability. Conversely, breakouts that occur within the Value Area on declining volume suggest algorithm-driven liquidity hunting without institutional follow-through.
Timeframe selection dramatically impacts fakeout exposure. The 1-minute chart produces far more false breaks than tradable ones, which makes entries unreliable without additional confirmation. The 15-minute to 4-hour timeframes cut that noise substantially when combined with the volume filter. Daily and weekly timeframes reduce it further but sacrifice the early-entry advantage. volume divergence patterns reveal when volume momentum diverges from price momentum, signaling breakout weakness.
How to Trade Breakout Patterns and Retests?
The break-and-retest model is a risk-mitigation strategy where traders execute entries only after price validates a broken level as new support or resistance. The retest filter removes the trades that fail immediately, at the cost of the initial momentum capture.
Trading channels, triangles and wedges provides the geometric framework for identifying breakout-eligible patterns. Symmetrical triangles usually resolve before price reaches the right edge of the pattern. Descending triangles bias downward breaks; ascending triangles bias upward breaks. Channels generate breakouts when price breaches either the upper resistance or lower support line.
Managing OCO (One-Cancels-the-Other) orders on symmetrical setups protects against ambiguous breakout direction. Setting a buy-stop above the channel’s upper bound and a sell-stop below the lower bound executes only the breakout that occurs first. VWAP (Volume-Weighted Average Price) reclaim signals offer additional confirmation, when price closes above VWAP after a breakout, institutional accumulation is occurring.
Real trading example:
Executing a buy-stop at 1.0850 on EUR/USD after identifying a 150% volume spike above the daily resistance triggered entry as the London session opened. The breakout captured 50 pips of directional momentum before consolidating at a new support level. Past performance is not indicative of future results.
What Are the Key Breakout Trading Metrics for 2026?
Breakout trading metrics in 2026 reveal that execution speed and sector selection are the primary drivers of profitability. The following data quantifies the operational environment for breakout traders.
One part of that environment is measurable rather than asserted. BIS Working Paper 955, Quantifying the high-frequency trading “arms race”, finds that latency races account for roughly a fifth of trading volume and around a third of the effective spread on the venue it studies. That is the cost of trading against speed, and it is why breakout entries are filtered on volume rather than taken on the break itself.
How to Manage Risks and Avoid False Breakouts?
Risk management in breakout trading is the systematic process of setting stop-losses outside of the ‘liquidity hunt’ zones to protect capital. Liquidity hunt zones occur 1-3% beyond support or resistance lines where algorithms trigger stop orders before reversing. Placing your stop 4-5% beyond the breakout level avoids these predictable liquidation points.
ATR (Average True Range) volatility provides a mathematical approach to stop placement. Using 2-period ATR as your stop distance accounts for real market volatility rather than arbitrary percentage levels. On a breakout with 120-point ATR, placing a 240-point stop (2 ATR) provides adequate buffer against algorithm-driven reversals.
The “Midday Lull” that sits between the European close and the late US session sees thinner institutional participation and a higher share of false breaks. Avoiding breakout trades during that window filters out the lowest-quality signals. Psychological control prevents smarter risk management guide violations, revenge trading after fakeouts accumulates losses rapidly when applied to leveraged positions.
Turn Knowledge into Profit
You have done the reading, now it is time to act. The best way to learn is by doing. Open a free, no-risk demo account and practice your strategy with virtual funds today.
Open a Free Demo AccountKey Takeaways
- Breakout trading executes positions at the inception of new price trends, capturing momentum ahead of confirmation-based followers.
- The 150% volume threshold identifies institutional breakouts and separates them from the false-break noise that dominates 1-minute charts.
- High-frequency algorithms are heavily represented in breakout volume, so traders must account for algorithmic liquidity sweeps and stop hunts.
- The break-and-retest model raises the quality of entries by waiting for price to validate a broken level as new support or resistance.
- ATR-based stop-loss placement protects against algorithm-driven reversals by positioning stops outside predictable liquidity hunt zones.
- Daily and weekly timeframes cut fakeout risk sharply when combined with volume confirmation, trading slower trends with higher reliability.
Frequently Asked Questions
This article contains references to Breakout Trading and Volity, a regulated CFD trading platform. This content is produced for educational purposes only and does not constitute financial advice or a recommendation to buy or sell any financial instrument. Always verify current regulatory status and platform details before using any trading service. Some links in this article may be affiliate links.
What our analysts watch: Three filters separate a tradable breakout from a stop-hunt liquidity sweep. Volume on the breakout candle (a real break prints volume at least 1.5 times the 20-bar average; breaks on declining volume reverse roughly two-thirds of the time). Higher-timeframe alignment (a four-hour breakout that clears a daily-chart level carries materially higher follow-through than a four-hour breakout in the middle of a daily range). Stop placement outside obvious liquidity (the textbook stop just below a broken resistance is the same stop the algorithms hunt; placing the stop one full ATR beyond the line, accepting the larger size penalty, materially improves the win rate by removing the easy sweep). When all three line up, the breakout is investible; when any deteriorate, the trader sits on hands and waits.
Volity operates a trading platform and also publishes educational and analytical content about trading. The content on this page is for educational purposes only and should not be considered financial advice. Volity may benefit commercially when readers open trading accounts through links on this site.
Our content is produced and reviewed under documented editorial standards; see our comparison and review methodology.