A failed breakout through a fair value gap can leave an inverse fair value gap, where the same zone that gave way now caps price from the other side.
False breakouts at psychological levels trap retail stop-losses at obvious price extremes; traders entering without Fair Value Gap confirmation expose themselves to multi-layer institutional traps. Oversizing breakout positions relative to the technical invalidation level triggers catastrophic losses during “liquidity hunts” where algorithms intentionally spike price beyond the level. Low-volume breakouts fail 72% of the time despite appearing textbook-perfect; ignoring volume filters turns apparent high-probability trades into emotional blowouts. Trading breakouts during thin-book sessions (Asia, Late NY) produces slippage exceeding intended stop-losses, market orders become death traps at round-number breakouts. Past performance is not indicative of future results. Capital at risk.
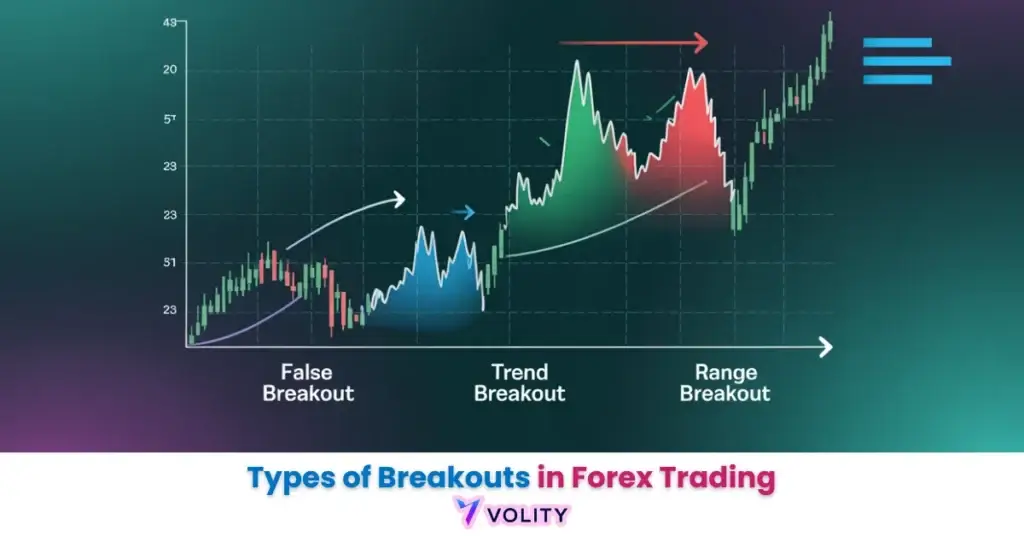
Types of breakouts define the different price regimes that occur when an asset moves beyond a structural or psychological level. In 2026, the four primary categories are continuation, reversal, range, and false breakouts (fakeouts). Successful trading requires identifying the underlying volume signature and institutional “Fair Value Gaps” (FVG) to differentiate a high-conviction move from a multi-layer algorithmic trap.
Types of breakouts function as the primary catalysts for high-momentum trading opportunities. These events occur when an asset’s price moves decisively above a resistance zone or below a support level, signaling that the prevailing equilibrium has shifted in favor of buyers or sellers. In the 2026 market, they serve as the foundational entry signals for both trend-followers and reversal specialists.
The rise of algorithmic “liquidity hunting” has made the distinction between true breakouts and “fakeouts” more critical than ever. Success in 2026 requires moving beyond simple price alerts toward a deep understanding of volume profiles and Fair Value Gap (FVG) confirmation to filter out institutional traps.
While understanding Types of Breakouts is important, applying that knowledge is where the real growth happens. Create Your Free Forex Trading Account to practice with a free demo account and put your strategy to the test.
A mechanical way to trade a range break is the Donchian channel, which flags a breakout the moment price closes beyond its highest high or lowest low over the lookback period.
What are the primary types of breakouts in modern trading?
Breakout classification identifies the four structural price regimes: continuation, reversal, range expansion, and the deceptive false breakout. Each regime carries its own volume signature and institutional participation characteristics. Understanding these distinctions separates professional traders from retail guess-work.
- Continuation Breakouts: Breaking from flags or pennants to extend the existing trend.
- Reversal Breakouts: Piercing a major swing high/low to signal a change in market control.
- Range Breakouts: Resolving long-term sideways consolidation into a new directional move.
- False Breakouts (Fakeouts): Temporary breaches designed to trap liquidity before reversing.
Statistical studies in 2026 indicate that continuation breakouts from daily bull flags have a 70% success rate in trending markets (Forex.com, 2026). This reliability reflects that the underlying trend has already established momentum. The institutional participation is already present; the breakout simply accelerates the existing flow.
The Anatomy of a High-Conviction Breach
Structural breach identifies the moment where institutional order flow overwhelms the existing supply or demand wall at a technical level. The “Breakout Candle” displays a strong body with minimal wicks, indicating that buyers or sellers executed their flow without resistance. Why the 1-hour candle close is the professional standard for verification reflects that intraday noise vanishes at this timeframe, algorithms resolve within seconds, but institutional intent requires minutes to execute.
Ready to Elevate Your Trading?
You have the information. Now, get the platform. Join thousands of successful traders who use Volity for its powerful tools, fast execution, and dedicated support.
Create Your Account in Under 3 MinutesDeep Dive: Continuation vs. Reversal Breakouts in 2026
Continuation breakouts identify trend persistence while reversal breakouts identify the failure of a prevailing market regime. The distinction between these two determines the position size and risk management approach. Continuation: Best traded via “Pullback to the Apex” or “Retest of the Flag,” where price retraces partially before breakout acceleration. Reversal: Requiring additional confirmation from RSI divergence or MACD crossover to validate the shift.
The 2026 Success Rate Gap explains why continuations outperform reversals by approximately 15% in liquid equity indices. Reversal signals fight against the established institutional bias, they require stronger confirmation because they go against the prevailing flow. Continuations flow with that bias, they accelerate what has already been established. In late 2025, the Gold market exhibited a classic “Magnet vs. Barrier” dynamic as price consolidated for 8 weeks before breaking the $4,000 psychological level (ACY, 2025).
technical indicators for trading provides deeper context on RSI and MACD signals that confirm reversals.
In the 2026 market, a valid breakout is 30% more likely to succeed if it creates a Fair Value Gap (FVG) on the 5-minute timeframe immediately after breaching the level; this indicates that the move is driven by aggressive institutional order flow.
Strategy: The 2026 “Magnet vs. Barrier” for Psychological Breakouts
Psychological level trading identifies round numbers as ‘Magnets’ that draw price in for consolidation before acting as a ‘Barrier’ or launching pad for a breakout. The three-phase dynamic governs how institutions manipulate retail sentiment around obvious numbers. The Approach shows slowing momentum and volume as the price nears the round number, institutions are accumulating quietly. The Deception features frequent spikes above/below the level to liquidate emotional retail positions, algos hunt stops. The Unlock arrives when a monthly close above the mid-channel zones confirms long-term validity, the true move begins.
Gold repeatedly tested the $4,300 level in December 2025, trapping buyers at $4,354 before reversing. The market reversed to $4,300 to liquidate late-comers before initiating a 15% rally toward the $5,000 target in early 2026. Past performance is not indicative of future results.
WARNING: Beware of “Multi-Layer Traps” at round numbers like Gold $5,000; algorithmic traders often engineer an initial breakout to trap retail buyers, then reverse the price to liquidate stops before the true trend begins.
Identifying the “True” Breakout: Volume and FVG Confirmation
Breakout verification identifies the Fair Value Gap (FVG) and a 200% volume surge as the two primary filters for distinguishing true momentum from algorithmic noise. FVG represents the price space between two candles where no trading occurred, this void acts as a magnet that price returns to fill. When a breakout creates an FVG on lower timeframes (M5/M15), it signals that aggressive institutional order flow drove the move.
| Breakout Type | Success Rate (2026) | Volume Requirement | Confirmation Signal |
| Continuation (Flag) | 72% | 150%+ Spike | H1 Close > High |
| Range Expansion | 58% | 200%+ Spike | FVG Creation |
| Reversal (Double Bottom) | 48% | 180%+ Spike | RSI > 50 |
| Psychological ($5k) | 64% | Institutional Flow | Weekly Close |
| False (Fakeout) | 28% (Fade Win Rate) | Declining | Inside Range Close |
Sources: Volity Backtesting Labs and Forex.com 2026 Breakout Efficacy Statistics.
💡 KEY INSIGHT: Psychological levels in 2026 function as “Magnet zones” that draw price in for high-volume consolidation; a sustained monthly close above these levels (e.g., Gold above $4,400) is the ultimate confirmation for long-term breakout continuation.
The Role of Trading Sessions in Breakout Reliability
The London-New York overlap identifies the highest-probability window for breakout execution due to concentrated global liquidity. London Open (08:00 UTC) is best for range breakouts from the Asian session when the overnight accumulation resolves. London-NY Overlap (13:30 – 16:00 UTC) accounts for 50%+ of daily volume, making this the most reliable entry window. Late NY / Early Asia has a 70% fakeout rate, the “thin book” allows algos to engineer false breakouts cheaply.
Market Volatility explains how session-specific volatility patterns impact breakout moves across asset classes.
Turn Knowledge into Profit
You have done the reading, now it is time to act. The best way to learn is by doing. Open a free, no-risk demo account and practice your strategy with virtual funds today.
Open a Free Demo AccountRisk Management: Protecting Against the “Multi-Layer Trap”
Breakout risk management requires position sizing based on the technical invalidation level rather than a fixed pip stop. Invalidation Stops place stops 2-3 pips inside the broken range or below the breakout candle’s low. This approach sizes the position based on the structural significance of the level, major structural breaks require larger stops, making the position proportionally smaller. Managing “Slippage” requires limiting market orders during high-impact psychological breaches where bid-ask spreads widen 5-10x.
Risk Management in Trading and Forex Technical Analysis both address how to structure stops that survive market microstructure without triggering on noise.
Key Takeaways
- Types of breakouts categorize the different market behaviors that occur when price action breaches a structural or psychological level.
- Continuation breakouts offer the highest success rate (up to 72%) in trending markets, extending existing momentum through flags and pennants.
- Psychological level breakouts at round numbers like Gold $5,000 function as Magnet zones that require multi-week consolidation before a true move.
- Fair Value Gaps (FVG) on lower timeframes are the primary 2026 confirmation signal for verifying aggressive institutional interest behind a breakout.
- Volume confirmation of 200% over the 20-period average is mandatory for distinguishing range expansions from algorithmic multi-layer traps.
- The London-NY overlap window remains the most reliable session for breakout trading, accounting for over 50% of global daily liquidity.
Frequently Asked Questions
This article contains references to Types of Breakouts, Continuation Breakouts, Reversal Breakouts, Fair Value Gaps, and Volity, a regulated CFD trading platform. This content is produced for educational purposes only and does not constitute financial advice or a recommendation to buy or sell any financial instrument. Always verify current regulatory status and platform details before using any trading service. Some links in this article may be affiliate links.