Pivot point calculations are mathematical abstractions, not guaranteed price levels. Prices frequently “hunt” liquidity by overshooting pivot levels by 5-10 pips to trigger retail stops before reversing. High-frequency trading algorithms deliberately target clusters of stop-loss orders placed at rounded pivot levels, creating false breakouts. Relying on pivot levels without confluence confirmation (moving averages, candlestick patterns, volume) results in excessive false signals. Leverage amplifies losses when traders enter without proper risk management at pivot level touches. Capital at risk in all leveraged trading.
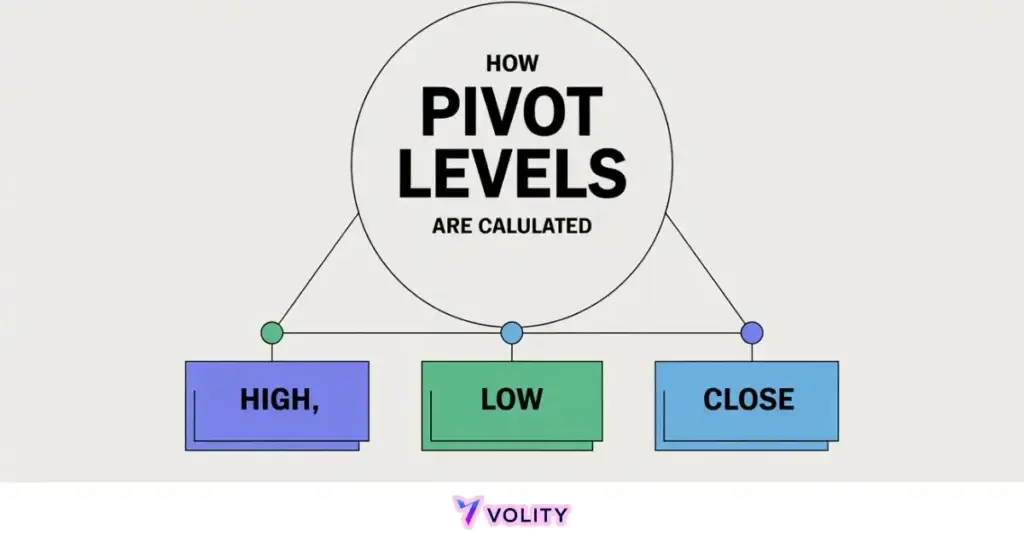
Pivot levels are mathematically derived price points that act as significant support and resistance benchmarks for intraday traders. By using the previous session’s high, low, and close, traders can calculate the central “Pivot Point” and its surrounding R/S levels. In 2026, understanding the variations between Standard, Camarilla, and Fibonacci pivots is essential for navigating automated market regimes.
Pivot levels function as the “map” of the trading day by providing objective price targets for entry and exit. This mathematical approach eliminates the subjectivity of traditional charting by relying exclusively on the previous session’s price extremes. It remains a foundational requirement for any systematic intraday strategy.
The 2026 market environment is increasingly dominated by high-frequency systems that utilize these levels to trigger automated liquidity sweeps. Consequently, understanding how to calculate and interpret the variations of the pivot formula is critical for retail traders to avoid being “stopped out” in volatile zones.
While understanding Pivot Levels Calculation is important, applying that knowledge is where the real growth happens. Create Your Free Forex Trading Account to practice with a free demo account and put your strategy to the test.
What is the standard pivot point formula and how does it work?
The standard pivot point formula is an arithmetic average of the previous period’s high, low, and closing prices that establishes the central reference for the current session. This mathematical foundation eliminates guesswork by producing objective, replicable levels. The simplicity masks the psychological power these levels exert on market structure.
The central pivot (P) calculation uses this core formula: P = (High + Low + Close) / 3, the arithmetic average of the prior period’s high, low and close (Pivot point). Some traders use division by 4 to include an opening price, but the 3-point average dominates institutional systems. Once the pivot is calculated, support and resistance levels extend symmetrically above and below this central point.
Psychology drives why price gravitates toward the central pivot in ranging markets. When institutional algorithms detect price approaching a pivot level, they trigger rebalancing orders. These automated executions create self-fulfilling prophecy, the level exists because traders expect it to exist. This collective expectation transforms mathematical averages into behavioral magnets.
Accuracy in the calculation is the whole point: the levels have no predictive content of their own, they work because a large number of participants compute the same numbers from the same inputs. A single error in the session data or the decimal places puts you on levels nobody else is watching.
Calculating the Resistance and Support Layers
The secondary layers of resistance and support are derived by multiplying the central pivot and subtracting the session extremes to define the trading range. These formulas create a symmetrical framework that extends price targets predictably.
The calculations follow this pattern:
- R1 = (2 × P) – Low
- S1 = (2 × P) – High
- R2 = P + (High – Low)
- S2 = P – (High – Low)
R1 represents the first resistance level where selling pressure typically appears. S1 represents the first support level where buying pressure typically appears. The gap between R1 and S1 encompasses the expected daily trading range. R2 and S2 represent secondary targets for breakout trades that extend beyond the initial trading zone.
Ready to Elevate Your Trading?
You have the information. Now, get the platform. Join thousands of successful traders who use Volity for its powerful tools, fast execution, and dedicated support.
Create Your Account in Under 3 MinutesWhat are the different types of pivot points used in 2026?
The four primary pivot variations identifies distinct mathematical approaches to weighted price action, including the Standard, Camarilla, Woodie, and Fibonacci methods. Each formula produces different level spacing, making them suited for different market regimes. Institutional traders often overlay multiple pivot types to identify confluence zones.
Camarilla pivots represent the “go-to” for 2026 breakout traders due to their narrow level spacing. Instead of averaging the high, low and close, Camarilla starts from the previous close and adds or subtracts the previous range scaled by fixed multipliers, the innermost pair using 1.1/12 of the range. This produces much tighter S1/R1 levels (typically 0.5% to 1.5% away from the central pivot instead of 2-3%). In low-volatility Asian sessions, this tighter spacing improves reversal identification dramatically. Camarilla levels are popular with intraday desks trading instruments such as the S&P 500, precisely because the tighter spacing gives a reversal trade a workable stop.
Woodie’s pivots emphasize the current open price to reduce lag. The formula is: P = (High + Low + (2 × Open)) / 4, one of the documented four-input variants of the pivot family alongside the closing-price weighted P = (High + Low + 2 × Close) / 4 (Pivot point). This weighting toward opening price makes Woodie pivots superior during fast reversals where the previous close becomes irrelevant. Traders using Woodie’s pivots catch trend acceleration early because their levels adjust for the current session’s momentum direction.
Fibonacci pivots integrate golden ratio percentages (38.2%, 61.8%) into the pivot structure. Instead of arithmetic division, this method calculates pivots using Fibonacci extension levels from the prior session’s range. Traders find these levels particularly useful in high-volatility environments where traditional pivots become too widely spaced.
DeMark’s pivots use a unique conditional calculation based on whether the close was higher or lower than the open. If close > open, the calculation uses different multiples than when close < open. This adaptability makes DeMark’s ideal for scalping intraday reversals where trend direction changes rapidly.
Which pivot point is most accurate for forex trading?
The Standard pivot point is the most widely followed benchmark for overall market structure, while Camarilla is preferred in low-volatility conditions because its levels sit closer together. The distinction between “most accurate” depends entirely on the market regime traders face. No single formula dominates all conditions.
Comparative performance data shows why the “Classic” Standard method remains the institutional standard, self-fulfilling prophecy. Because institutions and retail traders worldwide use Standard pivots, price actually respects these levels more than any other variation. The level’s accuracy stems from collective agreement, not mathematical superiority.
“Pivot Confluence”, where two different pivot types land on the same price, carries more weight than any single formula. When the S1 Standard pivot perfectly aligns with the H3 Camarilla level at 1.0920, the confluence signal carries higher conviction. This principle applies across all asset classes: overlapping levels from multiple methods signal institutional zones of interest.
Asset-specific accuracy reveals that different markets favor different pivot types. Standard pivots work best for forex pairs where global institutional participation is uniform. Fibonacci pivots outperform in gold and precious metals. Camarilla pivots excel in equities. This variation requires traders to understand which formula suits their specific trading pairs.
Worked illustration of the rule, not a recorded trade: a major pair trades down into its S1 Standard pivot, and the H3 Camarilla level computed from the same session sits at the same price. Two independent formulas landing on one number is the confluence signal. The long is taken there with the stop below both levels and the central pivot as the first target. Past performance is not indicative of future results.
How do automated systems use pivot points in 2026?
Algorithmic execution logic identifies that pivot levels act as primary liquidity triggers for high-frequency trading (HFT) and institutional rebalancing. These mathematical levels concentrate automated buy and sell orders, creating predictable institutional behavior.
| Pivot Type | Calculation Focus | Best Market Condition | Level Spacing | Typical Use |
| Standard | H/L/C Average | Trending / Ranging | Widest, range-defining | Session structure and targets |
| Camarilla | Weighted Close | Consolidation | Tightest, four levels either side | Intraday reversals |
| Fibonacci | Ratio Percentages | High Volatility | Ratio-based, widens with volatility | High-volatility instruments |
| Woodie’s | Current Open | Fast Reversals | Shifts with the current open | Fast reversals after a gap |
| DeMark’s | Open/Close Relation | Short-term Scalp | Conditional on the prior close | Short-term scalping |
The table describes how each formula spaces its levels. It is not a ranking of predictive accuracy, and no primary source publishes one.
HFT systems scan pivot levels continuously. When price approaches S1, algorithms initiate microsecond-speed buying that creates a “bounce” before the level actually breaks. When price approaches R1, selling algorithms activate. This mechanical behavior is why pivot levels “work”, not because of any inherent market wisdom, but because millions of algorithms are programmed to execute at these identical mathematical points.
Retail traders often get stopped out by these algorithmic liquidity sweeps. A trader places a stop-loss just below S1 assuming it will hold. HFT algorithms spike price through that level momentarily to trigger stops, collecting the liquidity, then reverse sharply. This “stop-hunting” is why confluence confirmation becomes critical, a single pivot level touched in isolation is vulnerable.
Common mistakes when calculating and using pivot points
Misinterpreting the session ‘Close’ and ignoring the daily timeframe represent the most frequent errors in pivot point application. These calculation errors propagate across entire trading systems, producing consistently inaccurate levels.
The timezone error represents the most common mistake. Calculating pivots on your local midnight instead of the globally recognized 5:00 PM EST produces levels that diverge from institutional algorithms. A trader in Tokyo calculating pivots on 00:00 JST generates completely different levels than traders using 5:00 PM EST. The resulting mismatch means your S1 level is where global traders have R2, a fatal misalignment.
Ignoring the higher timeframe creates a second critical error. Using 5-minute pivots while the daily trend is strongly bearish produces countertrend entry signals that fail consistently. Professional traders calculate pivots on the daily timeframe, then use smaller timeframe pivots only for entry refinement within that daily bias.
Failing to use confirmation blindly buys a “touch” of S1 without looking at candlestick patterns or volume. A single pivot level touch without RSI divergence, volume expansion, or candlestick reversal pattern is just price touching math, not necessarily a high-probability reversal. The risk management standard requires multiple confirmation layers.
Future trends: Pivot levels in the age of AI and 24/7 markets
Modern AI integration identifies ‘Dynamic Pivots’ that adjust in real-time based on order flow rather than static historical prices. These evolving levels represent the next generation of technical analysis beyond traditional pivot formulas.
The 24/7 crypto problem challenges the traditional 5:00 PM EST pivot model. Cryptocurrency trades continuously without a defined market close. Most 2026 traders use the 00:00 UTC time as the daily close to maintain consistency, but this arbitrary choice lacks the institutional weight that forex’s 5:00 PM EST close provides. As crypto markets mature, expect convergence on a unified global close time.
Order flow pivots use volume-weighted average price (VWAP) as a “living” pivot point that updates throughout the session. Instead of calculating once at market close, VWAP pivots recalculate continuously as volume patterns emerge. This dynamic approach captures intraday momentum shifts that static pivots miss.
Sentiment pivots represent an emerging 2026 development where levels adjust based on real-time news impact. AI systems detect major economic announcements, scan sentiment data, and dynamically shift pivot levels to reflect the new institutional positioning. A strong jobs report might push pivots higher before the market even opens, reflecting anticipated buying pressure.
Turn Knowledge into Profit
You have done the reading, now it is time to act. The best way to learn is by doing. Open a free, no-risk demo account and practice your strategy with virtual funds today.
Open a Free Demo AccountKey Takeaways
- Pivot level calculation is an objective technical method for establishing intraday support and resistance based on the previous session’s price data.
- The Standard pivot formula remains the most widely used benchmark in 2026, serving as a primary reference for institutional algorithmic execution.
- Camarilla pivots provide highly specific levels for breakout and reversal trades, making them superior for navigating low-volatility consolidation phases.
- Session timing is critical; traders must use the 5:00 PM EST market close to ensure their calculated levels align with the global financial community.
- Pivot confluence describes the high-probability scenarios where different pivot types or technical indicators overlap at the same price point.
- Automated systems in 2026 increasingly use these levels as liquidity triggers, making them essential for retail traders to avoid common “stop-loss” traps.
Frequently Asked Questions
This article contains references to pivot level calculation and Volity, a regulated CFD trading platform. This content is produced for educational purposes only and does not constitute financial advice or a recommendation to execute any specific trading strategy using pivot points. Pivot levels are mathematical abstractions that may not hold during news events or algorithmic liquidity runs; always verify your broker’s trading rules and maintain adequate risk management discipline before trading. Some links in this article may be affiliate links.