مؤشر الحيوية النسبية (RVI) هو مذبذب زخم يقيس القناعة، أو الحيوية، الكامنة خلف حركة السعر عبر مقارنة موضع إغلاق الشمعة بنطاق تداولها الكامل. والفكرة مباشرة: في الاتجاه الصاعد القوي تميل الأسعار إلى الإغلاق قرب القمة، وفي الاتجاه الهابط القوي تغلق قرب القاع. ويحوّل RVI هذا الميل إلى خط إشارة يمكنك تداوله.
ما هو مؤشر الحيوية النسبية؟
طوّر جون إيلرز مؤشر الحيوية النسبية وشاع في كتابه Rocket Science for Traders. وينتمي المؤشر إلى عائلة مذبذبات الزخم نفسها التي تضم الستوكاستك ومؤشر RSI، وهي أدوات محدودة النطاق تُرسم في لوحة منفصلة أسفل السعر. وما يميز RVI هو مدخله: فبدلًا من تتبع سعر الإغلاق مقابل نطاق مرجعي، يتتبع العلاقة بين الافتتاح والإغلاق ثم ينسبها إلى نطاق الأعلى والأدنى للشمعة.
ويقوم المنطق على ملاحظة سوقية معروفة: حين يسيطر المشترون تميل الشمعة إلى الإغلاق أعلى من افتتاحها، وحين يهيمن البائعون يقع الإغلاق دون الافتتاح. وبتنعيم هذا الفارق بين الافتتاح والإغلاق عبر عدة شموع، يرشّح RVI ضجيج الشمعة المفردة ويبيّن ما إذا كان ضغط الشراء أو البيع الأخير مدعومًا بزخم حقيقي أم أن الحركة تستنفد طاقتها.
كيف يُحسب مؤشر الحيوية النسبية؟
في جوهره، مؤشر الحيوية النسبية نسبة واحدة تُنعَّم مرتين. واللبنة الخام لكل شمعة هي الإغلاق ناقص الافتتاح مقسومًا على الأعلى ناقص الأدنى:
RVI الخام = (الإغلاق − الافتتاح) / (الأعلى − الأدنى)
وشمعة واحدة من هذه النسبة أشد تقلبًا من أن تُتداول، لذا يطبّق إيلرز متوسطًا متحركًا مرجحًا متماثلًا عبر أربع شموع بأوزان 1 و2 و2 و1 مقسومة على 6. ويُطبَّق الترجيح نفسه على البسط، أي فارق الافتتاح والإغلاق، وعلى المقام، أي نطاق الأعلى والأدنى. ثم تُقسم القيمتان المنعَّمتان ويُؤخذ متوسطهما عبر الفترة المختارة، وهي عشر شموع في الأغلب.
- ابدأ بالبسط: خذ الإغلاق ناقص الافتتاح للشمعة الحالية والشموع الثلاث السابقة، ورجّح هذه القيم الأربع بأوزان 1 و2 و2 و1 ثم اجمعها.
- افعل الشيء نفسه للمقام باستخدام الأعلى ناقص الأدنى عبر الشموع الأربع ذاتها وبالأوزان نفسها.
- اقسم البسط المنعَّم على المقام المنعَّم، ثم خذ متوسط الناتج عبر الفترة المرجعية، وهي عشر شموع عادةً. وهذا يعطيك خط RVI.
- ابنِ خط الإشارة بتطبيق ترجيح الشموع الأربع نفسه (1 و2 و2 و1) على خط RVI ذاته. وتقاطع الخطين هو ما يولّد الإشارة.
ولن تحتاج أبدًا إلى حساب ذلك يدويًا. فكل حزمة رسوم بيانية جادة، بما فيها الأدوات داخل Volity MT، ترسم RVI وخط إشارته من بيانات السعر الخام تلقائيًا. ويظل فهم الرياضيات مهمًا لأنه يخبرك بما يتفاعل معه المؤشر: التوازن بين قناعة الافتتاح والإغلاق وحجم الشمعة. فنطاق واسع مع فارق ضئيل بين الافتتاح والإغلاق ينتج قراءة ضعيفة، وهو بالضبط الاستنفاد الذي بُني RVI لالتقاطه.
ماذا يشير إليه مؤشر RVI؟
يمنحك مؤشر الحيوية النسبية ثلاث إشارات قابلة للقراءة، مرتبة تقريبًا بحسب موثوقيتها.
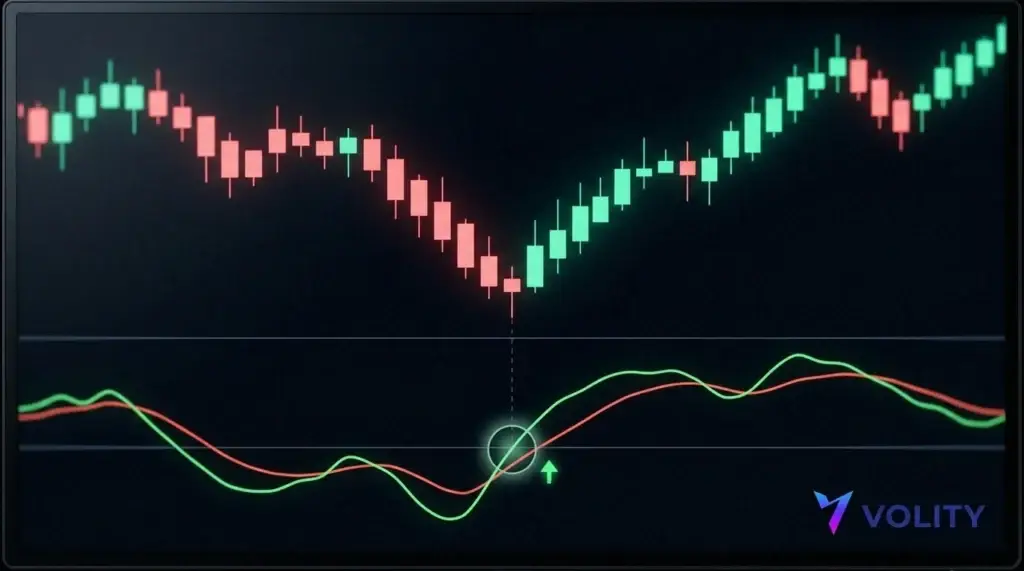
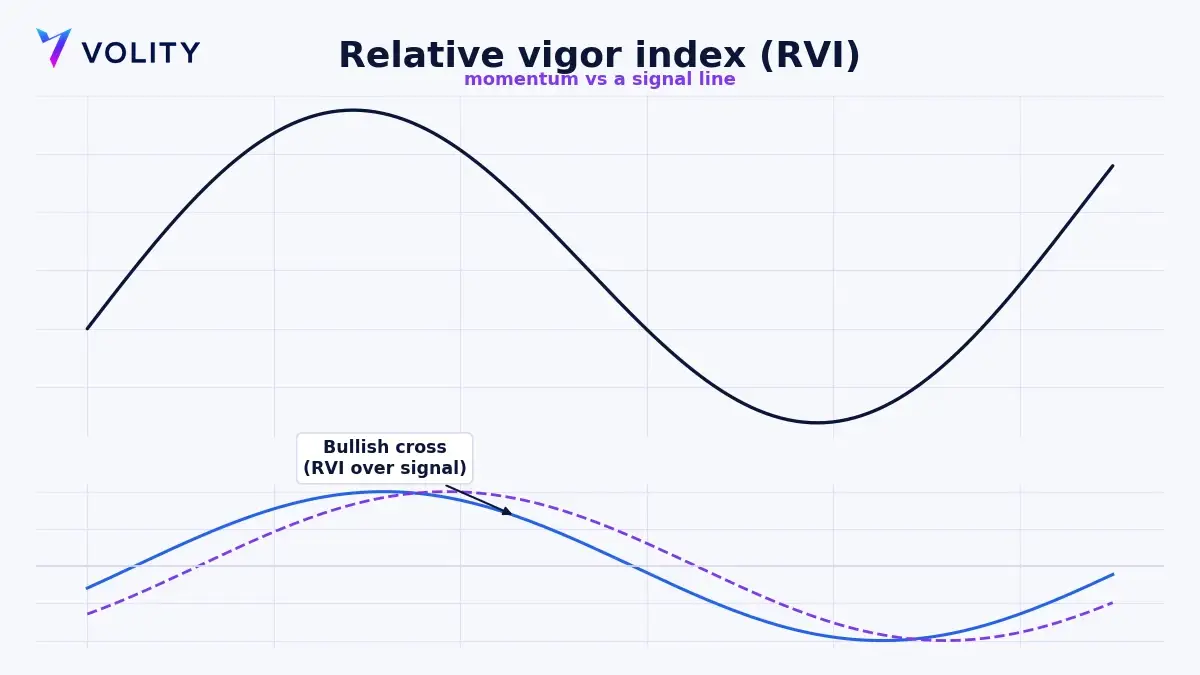
- تقاطع خط الإشارة هو المحفز الأساسي. فحين يعبر خط RVI فوق خط إشارته تتنامى حيوية الشراء وتكون القراءة صاعدة؛ والعبور تحته هابط. وهي الآلية نفسها التي أشاعت الستوكاستك.
- سلوك خط المنتصف يعمل مرشح انحياز. فمؤشر RVI يتذبذب حول الصفر، والقراءات التي تصمد فوق الصفر تدعم ميلًا صاعدًا كامنًا، والقراءات دونه تدعم ميلًا هابطًا. ويكتفي كثير من المتداولين بالتقاطعات الصاعدة ما دام RVI فوق خط المنتصف.
- التباعد هو حيث يثبت RVI قيمته غالبًا. فحين يطبع السعر قمة أعلى بينما يطبع RVI قمة أدنى، تكون الحيوية خلف الصعود آخذة في التلاشي قبل أن ينعكس السعر، وهو إنذار مبكر بانعكاس محتمل.
ولأن RVI مُنعَّم مرتين فهو أبطأ في الانقلاب من الستوكاستك الخام. والتنعيم الإضافي مقصود: فهو يقلل عدد التقاطعات الكاذبة في الظروف المتذبذبة، والثمن الذي تدفعه مقابل ذلك تأخر يسير حين يأتي الانعطاف الحقيقي أخيرًا.
كيف تتداول مؤشر الحيوية النسبية؟
الروتين العملي لاستخدام RVI يضع الإشارة فوق سياق الاتجاه بدل تداول كل تقاطع بلا تمييز. وهو يعمل بالطريقة نفسها على أزواج الفوركس والمؤشرات وعقود CFD على السلع.
- اقرأ اتجاه الإطار الزمني الأعلى أولًا باستخدام متوسط متحرك أو بنية بسيطة. فمؤشر RVI يعمل في أفضل حالاته أداةَ توقيت داخل اتجاه راسخ لا محدِّدًا للاتجاه بذاته.
- انتظر تقاطعًا في اتجاه ذلك الترند. ففي الاتجاه الصاعد خذ عبور RVI فوق خط إشارته قرب قاع تصحيحي؛ وفي الاتجاه الهابط خذ العبور تحته عند ارتداد.
- استخدم خط المنتصف للتأكيد، مفضّلًا الإشارات الصاعدة بينما RVI عند الصفر أو فوقه، والهابطة بينما هو عند الصفر أو دونه. فهذا المرشح وحده يزيل كثيرًا من ضجيج الحركة المعاكسة للاتجاه.
- ثبّت وقف الخسارة الحامي خلف التأرجح الذي أنتج الإشارة لا على مسافة اعتباطية، ودع الرسم البياني يحدد مخاطرتك.
- أدر الخروج حين يعود RVI ليعبر خط إشارته، أو حين يظهر تباعد ضد مركزك، أو حين يتحقق هدف محدد مسبقًا.
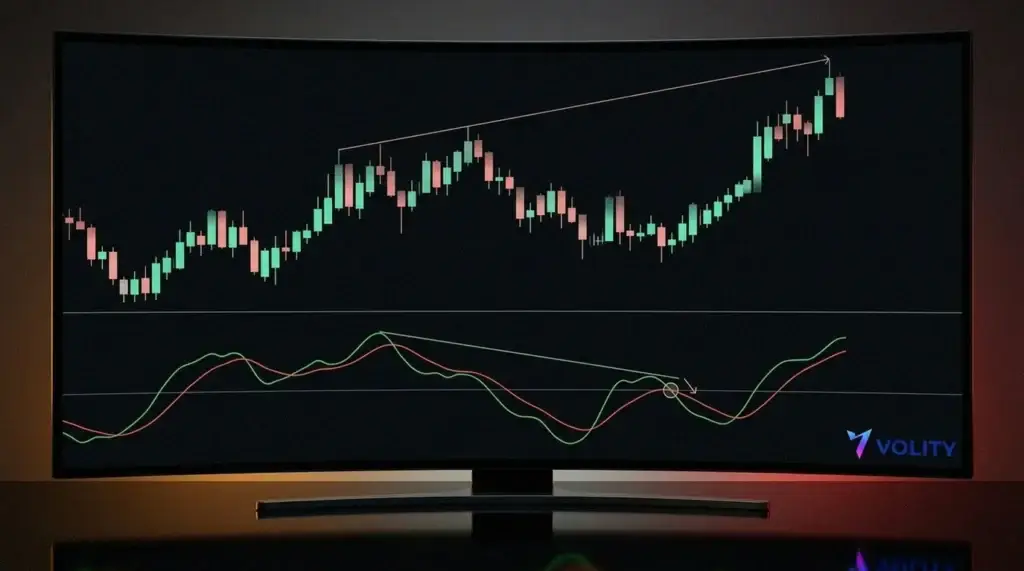
وتستحق صفقات التباعد ملاحظة منفصلة. فرصد تباعد هابط، أي قمة سعرية أعلى مقابل قمة RVI أدنى، ليس دخولًا بذاته. انتظر تقاطع خط الإشارة ليؤكد الانعطاف قبل أن تتحرك. فالتباعد يخبرك بأن الوقود يوشك على النفاد؛ والتقاطع يخبرك بأن السيارة بدأت تتراجع فعلًا.
ما الفرق بين RVI والستوكاستك وRSI؟
الثلاثة جميعًا مذبذبات زخم، لكنها تقيس أشياء مختلفة وتتصرف بطرق مختلفة. ويوضح هذا الجدول موضع RVI مقابل عائلة الماكد MACD من أدوات التقاطع ومقابل أشهر مذبذبَي النطاق.
| المؤشر | المدخل الأساسي | النطاق | الإشارة الأساسية | الاستخدام الأمثل |
| مؤشر الحيوية النسبية | فارق الافتتاح والإغلاق منسوبًا إلى نطاق الأعلى والأدنى | يتذبذب حول الصفر | تقاطع RVI مع خط الإشارة | تأكيد قناعة الاتجاه ورصد التباعد |
| مذبذب الستوكاستك | الإغلاق منسوبًا إلى نطاق الأعلى والأدنى الأخير | من 0 إلى 100 | تقاطع %K مع %D والتشبع الشرائي والبيعي | توقيت التصحيحات وانعكاسات النطاق |
| RSI | متوسط الحركات الصاعدة مقابل الهابطة | من 0 إلى 100 | عتبتا 70 و30 والتباعد | قياس أقصى التشبع الشرائي والبيعي |
وعمليًا يقرن كثير من المتداولين RVI بأداة قائمة على النطاق. فمؤشر RSI أو الستوكاستك يخبرك متى يكون السعر في تشبع شرائي أو ممتدًا؛ ويخبرك RVI ما إذا كانت الحركة التي تسحبه للخلف تحمل حيوية حقيقية. وحين يتفق الاثنان تكون الإشارة أقوى. وحين يختلفان يكون لديك سبب للوقوف جانبًا.
ما هي حدود مؤشر الحيوية النسبية؟
مؤشر الحيوية النسبية أداة تأكيد، وهو يخفق بالطرق التي تخفق بها أدوات التأكيد عادةً. ففي سوق عرضية منخفضة التقلب ينقلب فارق الافتتاح والإغلاق من شمعة إلى أخرى، فيتذبذب RVI عبر خط إشارته ويطلق تقاطعات متتابعة لا تفضي إلى شيء. كما يُدخل التنعيم المزدوج تأخرًا، فيمضي الجزء الأول من الانعكاس الحاد غالبًا قبل أن يؤكده التقاطع.
تعامل مع RVI بوصفه مدخلًا واحدًا ضمن خطة، لا نظامًا كاملًا. اجمعه ببنية الاتجاه وقراءة التقلب وتحجيم منضبط للمراكز. فالمنتجات ذات الرافعة مثل عقود CFD تضخّم الإشارات الصحيحة والخاطئة على السواء، لذا فإن وقف الخسارة ومخاطرة ثابتة لكل صفقة أمران أساسيان. وهما ما يمنع سلسلة من تقاطعات RVI المتذبذبة من التحول إلى تراجع جسيم في رأس المال.
كيف تتداول إعدادات RVI على Volity؟
Volity مركز مالي متكامل: حساب واحد لمحفظتك ومدفوعاتك وتداولك. وترسم أدوات الرسوم البيانية داخل Volity MT مؤشر الحيوية النسبية وخط إشارته على أي أداة، فتستطيع تطبيق منهج التقاطع وخط المنتصف والتباعد على أكثر من 40 زوج فوركس ومؤشرات عالمية وسلع وعملات رقمية من دون تبديل المنصات. وتتيح لك أنواع الأوامر المتقدمة إرفاق وقف خسارة وجني أرباح ووقف متحرك لحظة اقتناص الإشارة، ويمكنك رسم الإعداد كاملًا على الرسوم البيانية داخل منصة Volity.
ولأن RVI أنفع ما يكون في الأسواق ذات الرافعة والاتجاهين، فإنه يقترن طبيعيًا بتداول العقود مقابل الفروقات، حيث يمكنك التحرك على التقاطعات الصاعدة والهابطة معًا. وتصل الرافعة إلى 1:500 على أزواج الفوركس الرئيسية وتنخفض تدريجيًا للمؤشرات والسلع والعملات الرقمية، مع عرض الهامش المطلوب قبل كل أمر ومع حماية من الرصيد السالب. والتنفيذ منظم من CySEC عبر UBK Markets بالترخيص 186/12. ولأن عقود CFD تعمل بالرافعة فهي تنطوي على مخاطر عالية لخسارة الأموال سريعًا، وتقيّد جهات تنظيمية مثل ESMA طريقة تسويقها لمتداولي التجزئة، لذا حجّم كل مركز انطلاقًا من وقفه وراجع فروق السعر والتبييت لأداتك على صفحة الرسوم والتكاليف المنشورة. ويمكنك فتح حساب مجانًا والتدرب على الإعداد في حساب تجريبي والاستثمار بدءًا من دولار واحد وبدء التداول من 1 دولارًا بمجرد أن تتمكن من انتظار إشارة نظيفة وسط الضجيج.
وللاطلاع على مجموعة الأدوات الأوسع التي ينتمي إليها RVI، راجع دليل المؤشرات الفنية للتداول.
أنماط ذات صلة
الأسئلة الشائعة
هل مؤشر الحيوية النسبية مؤشر جيد؟
مؤشر الحيوية النسبية أداة تأكيد موثوقة داخل سوق ذات اتجاه، خصوصًا لرصد تلاشي الزخم عبر التباعد. وهو أضعف بمفرده في الظروف المحصورة في نطاق، حيث ينتج تقاطعات كاذبة متكررة. ويستخدمه معظم المتداولين إلى جانب مرشح اتجاه ومذبذب نطاق بدلًا من الاعتماد عليه نظامًا قائمًا بذاته.
ما هي أفضل إعدادات RVI؟
الإعداد القياسي لمؤشر الحيوية النسبية هو فترة مرجعية من عشر شموع مع خط الإشارة المدمج ذي الشموع الأربع. والفترات الأقصر تجعل RVI أسرع وأكثر ضجيجًا، وهو ما يناسب السكالبينج؛ والفترات الأطول تجعله أنعم وأبطأ، وهو ما يناسب التداول التأرجحي. اختبر أي تغيير على بيانات تاريخية لأداتك وإطارك الزمني قبل تداوله فعليًا.
ما الفرق بين RVI ومذبذب الستوكاستك؟
يستخدم الاثنان تقاطع خطين، لكن المدخلات تختلف. فمذبذب الستوكاستك يقيس موضع الإغلاق داخل نطاق الأعلى والأدنى الأخير وهو محصور بين 0 و100. أما RVI فيقيس فارق الافتتاح والإغلاق منسوبًا إلى نطاق الشمعة ويتذبذب حول الصفر. والستوكاستك أفضل لرصد أقصى التشبع الشرائي والبيعي؛ وRVI أفضل لتأكيد القناعة الكامنة خلف الحركة.
هل يمكن استخدام مؤشر الحيوية النسبية في أي سوق؟
نعم. لأنه لا يحتاج سوى بيانات الافتتاح والأعلى والأدنى والإغلاق، يعمل مؤشر الحيوية النسبية على الفوركس والمؤشرات والسلع والأسهم والعملات الرقمية عبر أي إطار زمني. وعلى Volity MT يمكنك تطبيقه على كل أداة ضمن حساب واحد. ويتوقف أداؤه على ما إذا كانت السوق ذات اتجاه أكثر بكثير مما يتوقف على فئة الأصول التي تطبقه عليها.