Trendlinien sind subjektive Werkzeuge, die anfällig für Curve-Fitting und Überoptimierung sind. Das Durchbrechen einer Trendlinie garantiert keine Umkehr; fast 40 % bis 70 % der Durchbrüche sind Fakeouts, die darauf ausgelegt sind, Stop-Loss-Orders von Privatanlegern auszulösen. Frühe Einstiege vor dem Schließen der Kerze führen oft zu Whipsaws. Steile Trendlinien (>45 Grad) sind nicht nachhaltig und neigen zu schnellen Fehlschlägen. Algorithmische Liquiditätsjagden durchbrechen absichtlich offensichtliche Trendlinien, bevor sie eine Umkehr einleiten. Die Wertentwicklung in der Vergangenheit ist kein Indikator für zukünftige Ergebnisse. Kapital ist gefährdet.
Eine Trendlinie ist ein grafisches Werkzeug, das zwei oder mehr signifikante Preispunkte verbindet, um die Steigung und Stärke eines Markttrends zu definieren. Im Jahr 2026 priorisieren professionelle Trader die „Dreierregel“ (drei Berührungspunkte für die Gültigkeit) und nutzen Volumenbestätigungen, um institutionelle „Liquiditätsjagden“ herauszufiltern. Automatisierte regressionsbasierte Modelle helfen, die menschliche Voreingenommenheit beim manuellen Zeichnen von Trendlinien in den Gold- und Forex-Märkten zu beseitigen.
Eine Trendlinie fungiert als grundlegende visuelle Grenze für die Interpretation der Marktdynamik. Durch das Verbinden signifikanter Swing-Highs oder Swing-Lows ermöglichen diese Linien Anlegern, Preisbewegungen in „Aufwärtstrend“, „Abwärtstrend“ oder „Seitwärtsphase“ zu kategorisieren. Im Markt von 2026 bleiben sie das am häufigsten verwendete Werkzeug sowohl für die diskretionäre Analyse als auch für die algorithmische Ausführung.
Obwohl das Konzept einfach ist, erfordert die effektive Anwendung von Trendlinien im Jahr 2026 eine strikte Einhaltung von Validierungsregeln und Volumenbestätigungen. Da institutionelle Algorithmen zunehmend auf „Liquiditätscluster“ von Privatanlegern in der Nähe offensichtlicher Trendlinien abzielen, ist die Beherrschung der Nuancen zwischen „Retest“ und „Durchbruch“ für das moderne Überleben unerlässlich.
Das Verständnis von Forex ist wichtig, doch echtes Wachstum entsteht erst durch die Anwendung dieses Wissens. Kostenloses Forex-Handelskonto erstellen, um mit einem kostenlosen Demokonto zu üben und Ihre Strategie zu testen.
Was ist eine Trendlinie und warum ist sie essenziell?
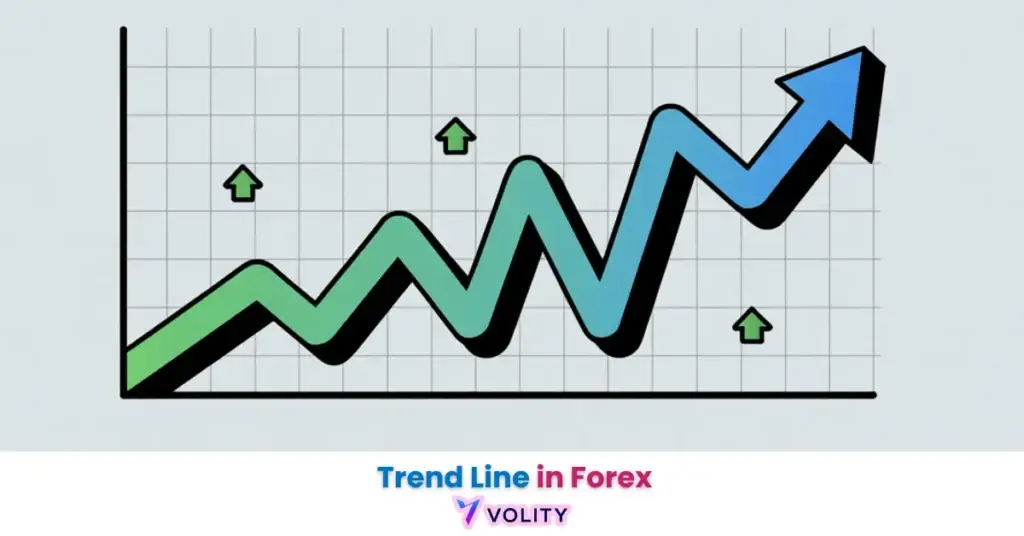
Eine Trendlinie ist eine grafische Darstellung der Marktstimmung, die eine Abfolge von Preispunkten verbindet, um die Steigung und Stärke eines Trends zu definieren.
Aufwärtstrends werden identifiziert, indem eine Reihe höherer Tiefs mit einer ansteigenden Linie verbunden wird, was visuell darstellt, dass Käufer jeden Rücksetzer konsequent verteidigen. Abwärtstrends verbinden tiefere Hochs mit einer abfallenden Linie und zeigen, dass Verkäufer jede Rallye verhindern. Diese Linien fungieren als dynamische Unterstützung und Widerstand, wenn der Preis von einer Aufwärtstrendlinie abprallt, bestätigt dies, dass Käufer auf diesem Niveau präsent sind; wenn der Preis einen Abwärtstrendwiderstand respektiert, bestätigt dies, dass der Verkaufsdruck intakt bleibt.
Der Wandel vom manuellen, „subjektiven“ Zeichnen von Linien hin zur automatisierten, „objektiven“ Regressionsanalyse definiert die moderne Handelslandschaft von 2026. Automatisierte Trendliniensysteme platzieren Linien in disziplinierten Forex-Umgebungen mithilfe der Multi-Anchored-Regression objektiv und ersparen damit einen Großteil des Rätselratens beim visuellen Zeichnen. Institutionen respektieren diese visuellen Grenzen, da jahrzehntelange Wiederholungen der Preisbewegungen zu echten Orderflow-Clustern auf diesen Niveaus geführt haben.
Docht vs. Körper: Die Konstruktionsdebatte 2026
Die Konstruktionsmethodik identifiziert die Wahl zwischen dem Verbinden von Kerzendochten für die gesamte Preisspanne oder Kerzenkörpern für hochkonfidente Schlusskursdaten.
Scalper verbinden Dochte, um die maximale Spanne zu erfassen, einschließlich der Liquiditäts-Sweeps, die über die Schlusskurse hinausgehen. Swing-Trader verbinden Körper, um Stop-Hunts herauszufiltern und sich darauf zu konzentrieren, wo der Preis tatsächlich geschlossen hat, wodurch Intraday-Rauschen eliminiert wird, das möglicherweise kein echtes Engagement darstellt. Die Verwendung von Körpern erzeugt breitere, stabilere Trendlinien, die von Institutionen respektiert werden, während die Verwendung von Dochten die Extreme erfasst, die Algorithmen absichtlich jagen.
Bereit, Ihr Trading auf das nächste Level zu bringen?
Sie haben das Wissen. Jetzt fehlt die Plattform. Schließen Sie sich Tausenden erfolgreichen Tradern an, die Volity für leistungsstarke Tools, schnelle Ausführung und engagierten Support nutzen.
Erstellen Sie Ihr Konto in unter 3 MinutenWie man im Jahr 2026 eine robuste Trendlinie zeichnet und validiert
Die Validierung einer Trendlinie im Jahr 2026 erfordert die „Dreierregel“, bei der drei deutliche Preisberührungen erforderlich sind, um die strukturelle Integrität der Linie zu bestätigen.
Die Auswahl von „hochwertigen“ Drehpunkten ist enorm wichtig, ein Swing-High muss von mindestens 3 Balken mit niedrigeren Preisen auf beiden Seiten umgeben sein, um als echt zu gelten. Die 45-Grad-Regel besagt, dass Trendlinien, die steiler als 45 Grad sind, nicht nachhaltig sind und schnell brechen werden; nachhaltige Trends verlaufen typischerweise zwischen 20 und 40 Grad. Die Validierung über mehrere Zeitrahmen hinweg erhöht die Zuverlässigkeit: Eine H4-Trendlinie, die mit dem täglichen institutionellen Bias übereinstimmt, hat ein 5-mal höheres Gewicht als eine isolierte Stundenlinie.
Die Ergebnisse manueller Trendlinienstrategien schwanken stark, vor allem wegen des subjektiven „Curve-Fittings“, bei dem Trader Linien wiederholt anpassen, um Trades zu rechtfertigen. Professionelle Trader fixieren ihre Trendlinie sofort nach der dritten Berührung und weigern sich, sie anzupassen, wodurch die emotionale Voreingenommenheit eliminiert wird, die die meisten Privatanleger ruiniert.
Zeichnen Sie Trendlinien immer auf hohen Zeitrahmen (H4 oder täglich), um den institutionellen Bias zu identifizieren, aber nutzen Sie den 1-Stunden-Chart, um Einstiege zu timen; dieser „Top-Down“-Ansatz reduziert das Risiko, in Intraday-Rauschen gefangen zu werden, das häufig Linien auf niedrigeren Zeitrahmen durchbricht.
Strategie: Die Durchbruch- vs. Retest-Methode 2026
Der Vorteil der Retest-Strategie entsteht dadurch, dass man wartet, bis der Preis zu einer durchbrochenen Trendlinie zurückkehrt, bevor man einsteigt.
Der Durchbruch erfolgt, wenn eine H1-Kerze entscheidend über die Trendlinie hinaus schließt, begleitet von einem Volumensprung von 150 %+, was signalisiert, dass institutionelle Verkaufs- oder Kaufaufträge die defensiven Orders überwunden haben. Der Retest folgt, wenn der Preis zur durchbrochenen Trendlinie zurückkehrt und einen „Ablehnungsdocht“ oder eine strukturelle Verschiebung auf dem 5-Minuten-Chart zeigt, was bestätigt, dass der Durchbruch echt war und kein Liquiditäts-Sweep.
Gold durchbrach im Februar 2026 eine wichtige 4-Stunden-Abwärtstrendlinie bei 4.850 USD. Der Preis testete die Linie als Unterstützung, hielt stand und stieg innerhalb von drei Handelstagen auf 5.120 USD, was ein Chance-Risiko-Verhältnis von 1:4 bot. Dieser Retest-Ansatz erfasste die nachhaltige Bewegung und vermied gleichzeitig die falschen Durchbruchseinstiege, die bei 4.845 USD ausgelöst wurden.
Häufige Fehler
Trendliniendurchbrüche bei sinkendem Volumen entpuppen sich häufig als „Bullen-“ oder „Bärenfallen“.
| Marktregime | Volumenanforderung |
| Hohe Dynamik | 200 %+ Sprung |
| Geringe Volatilität | Unterdurchschnittlich |
| Seitwärtsmarkt | Flach |
| Institutionelle Jagd | Volatile Sprünge |
| Makro-Umkehr | Steigend |
Umgebungen mit geringer Volatilität führen zu besonders schwachen Trendliniendurchbrüchen, da dem Preis die Überzeugung fehlt, Bewegungen über historische Linien hinaus aufrechtzuerhalten. Institutionelle Jagden drücken den Preis absichtlich über offensichtliche Trendlinien, um Stop-Loss-Orders von Privatanlegern auszulösen, bevor sie in die entgegengesetzte Richtung drehen, was eigenständige Durchbruchseinstiege besonders gefährlich macht. Retest-Einstiege bewähren sich in allen Regimen und sind in einer Makro-Umkehrumgebung besonders wirksam.
WARNING: Vermeiden Sie „Curve Fitting“, bei dem Sie eine Trendlinie zwingen, einen bestimmten Drehpunkt zu berühren, nur um einen Trade zu rechtfertigen; wenn eine Linie mehr als zwei geringfügige Anpassungen erfordert, um zur Preisbewegung zu passen, befindet sich der Trend wahrscheinlich in einer volatilen Phase.
Fortgeschrittene Werkzeuge
Automatisierte Regressionskanäle identifizieren den mathematisch „besten“ Pfad für den Preis und reduzieren den menschlichen Fehler, der dem manuellen Zeichnen innewohnt.
Die verankerte lineare Regression stellt die professionelle Wahl für 2026 dar, da sie die optimale Steigung berechnet, die den Abstand zu allen Preispunkten gleichzeitig minimiert. KI-Trendscanner wie LuxAlgo identifizieren automatisch Trendlinien mit >70 % Konfidenz, indem sie Tausende von Permutationen durchlaufen, um statistisch signifikante Steigungen zu finden. Die Fallstudie zum Gold-Crash vom 30. Januar zeigte, dass automatisierte Systeme manuelle Linien um 10 % übertrafen, da Algorithmen Curve-Fitting und emotionale Anpassungsvoreingenommenheit vermeiden.
Institutionelle Trader verlassen sich zunehmend auf diese mathematischen Ansätze, da sie Subjektivität eliminieren und gleichzeitig die Geschwindigkeit der visuellen Analyse beibehalten. Der Wandel hin zur Automatisierung erklärt, warum manuelle Trader im Jahr 2026 Schwierigkeiten haben, der Wettbewerb hat sich vom Zeichnen von Linien hin zum Ausführen statistischer Modelle entwickelt.
💡 KEY INSIGHT: Die „Retest-Einstiegs“-Strategie ist in der Regel verlässlicher als die des „Durchbruch-Einstiegs“; das Warten darauf, dass der Preis zur durchbrochenen Trendlinie zurückkehrt, verbessert das Chance-Risiko-Verhältnis erheblich.
Wissen in Gewinn verwandeln
Sie haben gelesen, jetzt ist es Zeit zu handeln. Der beste Weg zu lernen ist durch Praxis. Eröffnen Sie ein kostenloses, risikofreies Demokonto und üben Sie Ihre Strategie noch heute mit virtuellem Guthaben.
Kostenloses Demokonto eröffnenUnterschied zwischen Trendlinien und gleitenden Durchschnitten
Mathematische Berechnungen identifizieren den Unterschied zwischen der manuell verankerten Trendlinie und der zeitlich gemittelten Berechnung von gleitenden Durchschnitten.
Trendlinien verbinden spezifische Preispunkte und bleiben fixiert, sobald sie gezeichnet sind, was sie reaktionsfähig auf strukturelle Drehpunkte macht, aber subjektiv in der Konstruktion. Gleitende Durchschnitte glätten Preisdaten über ’n‘ Perioden mathematisch, was Subjektivität entfernt, aber eine Verzögerung einführt. Trendlinien funktionieren am besten für die Identifizierung von Ausbruchsmöglichkeiten, da sie den genauen Moment erfassen, in dem der Preis die Struktur durchbricht; gleitende Durchschnitte funktionieren am besten für die Bestätigung der Trendstärke und die Identifizierung von Rücksetzern innerhalb anhaltender Bewegungen.
Professionelle Trader verwenden beides zusammen: Trendlinien für Ausbruchseinstiege und gleitende Durchschnitte für das Positionsmanagement und die Bestätigung von Rücksetzern. Ein Preisrücksetzer auf den 50-Tage-Durchschnitt während eines Aufwärtstrends, kombiniert mit der Unterstützung durch eine ansteigende Trendlinie, erzeugt eine doppelte Bestätigung, die den Einstieg deutlich zuverlässiger macht.
Wichtige Erkenntnisse
- Trendlinien sind grundlegende Werkzeuge zur Identifizierung des Richtungs-Bias sowie dynamischer Unterstützungs- und Widerstandsniveaus eines Finanzwerts.
- Die Dreierregel ist der verbindliche Validierungsstandard für 2026 und erfordert drei deutliche Preisberührungen, damit eine Trendlinie als handelbar gilt.
- Retest-Einstiege bieten in der Regel ein besseres Chance-Risiko-Verhältnis als aggressive Ausbruchseinstiege.
- Automatisierte Regressionsmodelle eliminieren die menschliche Voreingenommenheit und das Curve-Fitting, die dem manuellen Zeichnen innewohnen.
- Eine Volumenbestätigung von 150 % bis 200 % über dem Durchschnitt der 20-Perioden ist entscheidend, um institutionelle „Liquiditätsjagden“ und falsche Durchbrüche herauszufiltern.
- Trendlinien auf hohen Zeitrahmen (H4 und täglich) dienen als „Kompass“ für fortgeschrittene Trader und filtern das Rauschen der Volatilität auf niedrigeren Zeitrahmen heraus.
Häufig gestellte Fragen
Dieser Artikel enthält Verweise auf Trendlinien, technische Analyse und Volity, eine regulierte CFD-Handelsplattform. Dieser Inhalt wurde nur zu Bildungszwecken erstellt und stellt keine Finanzberatung oder Empfehlung zum Kauf oder Verkauf eines Finanzinstruments dar. Überprüfen Sie immer den aktuellen regulatorischen Status und die Plattformdetails, bevor Sie einen Handelsdienst nutzen. Einige Links in diesem Artikel können Affiliate-Links sein.