Kurze Antwort
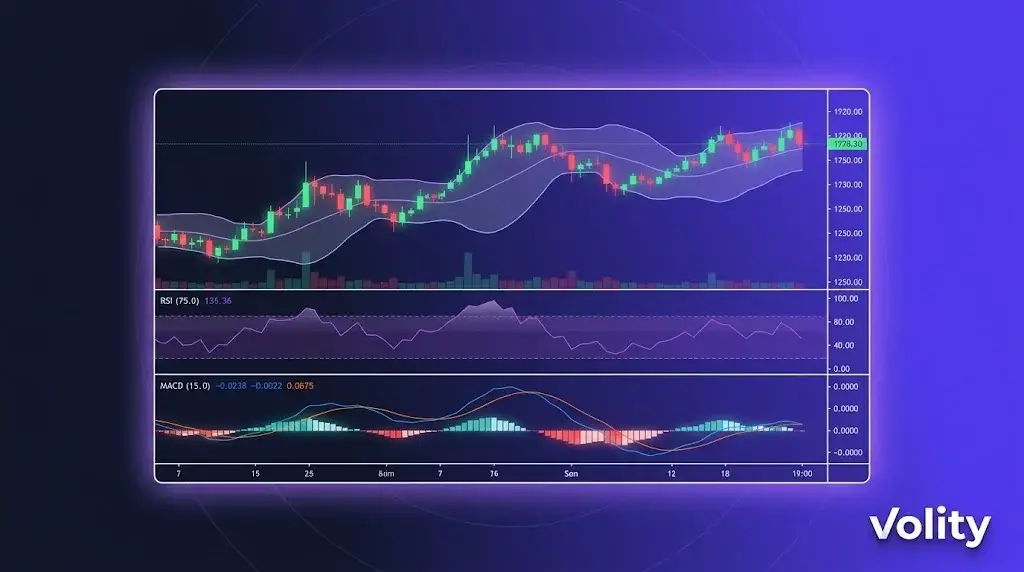
Krypto-Trading-Charts stellen den Preis einer Münze über die Zeit dar und sind die Grundlage der technischen Analyse. Kerzencharts sind am beliebtesten und zeigen Eröffnung, Hoch, Tief und Schluss jeder Periode. Charts zusammen mit Trendlinien, Unterstützung und Widerstand, Volumen und Indikatoren zu lesen, hilft Tradern, Ein- und Ausstiege zu timen. Auf Volity werden die Charts von TradingView betrieben.
Krypto-Trading-Charts auf Volity MT integrieren die Charting-Engine von TradingView direkt in die Handelsoberfläche. Sie erhalten über 100 technische Indikatoren, benutzerdefinierte Zeichnungen, Pine Script für eigene Indikatoren, Ansichten für mehrere Zeitrahmen und die Ausführung von Orders direkt aus dem Chart. Die Charts werden über Mobilgeräte, Desktop und Web synchronisiert. Diese Seite behandelt die Charting-Funktionen und deren Anwendung.
Krypto-Trading-Charts auf Volity: Was Sie erhalten
TradingView-Engine in Volity MT. Keine separate App; das Chart-Panel in Volity MT ist TradingView. Das bedeutet:
- Über 100 integrierte technische Indikatoren (RSI, MACD, Bollinger Bänder, Ichimoku, Volumenprofil, etc.)
- Benutzerdefinierte Indikatoren via Pine Script
- Ansichten für mehrere Zeitrahmen (öffnen Sie dasselbe Paar gleichzeitig auf 1m, 5m, 1h, 4h, täglich)
- Zeichenwerkzeuge (Trendlinien, Fibonacci, Elliott-Wellen, Volumenprofil-Zonen)
- Intelligente Zeichnungen, die sich automatisch über Zeitrahmen hinweg erweitern
- Chart-basierte Ordererteilung (klicken Sie auf ein Preisniveau, um eine Order zu platzieren)
Echtzeitdaten hinter Krypto-Trading-Charts
Live-Tick-Daten für alle über 20 Krypto-Paare sowie Forex, Indizes, Aktien und Rohstoffe. Dieselbe Ausführungs-Engine, die Ihre Orders ausführt, speist auch die Chart-Preise, sodass der angezeigte Kurs mit dem Kurs übereinstimmt, zu dem Ihre Order ausgeführt wird (innerhalb der üblichen Slippage-Toleranz).
WebSocket-basiertes Streaming mit einer Latenz von unter 50ms vom Kurs-Update bis zur Chart-Darstellung. Bandbreitenoptimiert für Mobilfunkverbindungen auf Smartphones.
Top-Down-Workflow für mehrere Zeitrahmen
Ein gängiger Workflow, der mehrere Zeitrahmen kombiniert:
„ 1. Tages-Chart: Identifizieren Sie den Trend (Aufwärtstrend, Abwärtstrend, Seitwärtsphase) 2. 4-Stunden-Chart: Finden Sie ein Setup innerhalb des Trends (Pullback, Ausbruch, Umkehr) 3. 1-Stunden-Chart: Verfeinern Sie den Einstiegszeitpunkt für das Setup 4. 15-Minuten-Chart: Timing des Einstiegs innerhalb der Stunde 5. Order-Ticket: Platzieren Sie den Trade mit Stop und Ziel vom 4-Stunden-Niveau aus „
Volity MT unterstützt diesen Workflow mit synchronisiertem Fadenkreuz, Indikatoreinstellungen, die über Zeitrahmen hinweg bestehen bleiben, und der Möglichkeit, dasselbe Paar in mehreren Panels mit unterschiedlichen Zeitrahmen anzuzeigen.
Indikatoren, die man kennen sollte
Fünf Indikatoren, die den Großteil der technischen Analyse für Privatanleger abdecken:
1. Gleitende Durchschnitte (MA, EMA). Trendidentifikation. 50 und 200 sind die institutionellen Standardniveaus.
2. RSI (Relative Strength Index). Momentum und überkaufte/überverkaufte Zustände. Klassische 70/30-Schwellenwerte; 80/20 für stärkere Signale.
3. MACD. Trendänderungen und Momentum-Verschiebungen. Crossover-Signale sind häufige Einstiegsauslöser.
4. Bollinger Bänder. Volatilitätsausdehnung/-verengung. Range-Fade-Trader nutzen Bandberührungen; Ausbruch-Trader nutzen Band-Exits.
5. Volumenprofil. Zeigt an, wo das meiste Volumen auf jedem Preisniveau gehandelt wurde. Identifiziert Unterstützungs-/Widerstandszonen mit höherer Zuverlässigkeit als horizontale Linien.
Über 100 weitere Indikatoren sind verfügbar; diese fünf bilden das Fundament, auf dem die meisten Strategien für Privatanleger aufbauen.
Pine Script für benutzerdefinierte Indikatoren
Wenn ein integrierter Indikator nicht zu Ihrer Strategie passt, können Sie mit Pine Script eigene erstellen. Pine ist die Skriptsprache von TradingView, die speziell für die technische Analyse entwickelt wurde.
Häufige Anwendungsfälle für benutzerdefinierte Pine-Skripte: – Kombination mehrerer Indikatoren zu einem einzigen zusammengesetzten Signal – Hinzufügen von Alarmen bei spezifischen Multi-Bedingungs-Setups – Visuelles Backtesting einer Strategie anhand historischer Daten – Erstellen benutzerdefinierter Plots (z.B. relative Stärke eines Assets gegenüber einem anderen)
Pine Script-Kenntnisse sind plattformübergreifend anwendbar; Skripte, die für TradingView geschrieben wurden, funktionieren in der Charting-Ebene von Volity MT.
Chart-basierte Ordererteilung
Drei Möglichkeiten, Orders aus dem Chart zu platzieren:
1. Klicken auf ein Preisniveau. Klicken Sie mit der rechten Maustaste auf einen beliebigen Preis im Chart und wählen Sie „Kaufen auf diesem Niveau“ oder „Verkaufen auf diesem Niveau“, um eine Limit-Order zu setzen. Die Order bleibt als horizontale Linie im Chart bestehen, die Sie verschieben können.
2. Drag-to-place Orders. Wenn der One-Click-Handel aktiviert ist, ziehen Sie vom aktuellen Preis auf einen Zielpreis, um einen Take-Profit zu setzen. Ziehen Sie auf ein Stop-Niveau, um den Stop zu setzen.
3. Order-Panel in der Seitenleiste. Standard-Order-Ticket neben dem Chart mit Eingabefeldern für Größe, Hebel, Stop und Ziel.
Chart-Synchronisierung über Geräte hinweg
Charts, Indikatoren, Zeichnungen und Watchlists werden über Volity MT Mobile (iOS, Android), Desktop (Windows, Mac) und Web synchronisiert. Öffnen Sie auf Ihrem Smartphone dasselbe Chart-Layout, das Sie auf dem Desktop geschlossen haben. Zeichnungen bleiben erhalten; Alarme bleiben bestehen.
Alarme
Setzen Sie Chart-basierte Alarme für:
- Preisniveaus (über/unter)
- Indikator-Crossovers (z.B. RSI kreuzt 70)
- Berührungen von Zeichenwerkzeugen (z.B. Preis erreicht Trendlinie)
- Benutzerdefinierte Pine Script-Bedingungen
Alarme werden per In-App-Benachrichtigung, Push-Benachrichtigung (mobil), E-Mail und (bei VIP) per Webhook an Ihre eigenen Systeme übermittelt.
Einschränkungen
- Die Tiefe der Chart-Historie variiert je nach Instrument: 5-10 Jahre bei wichtigen Forex- und Krypto-Paaren; weniger bei kleineren Altcoins
- Die Ausführung von Pine Script ist in einer Sandbox isoliert; einige fortgeschrittene Funktionen (Netzwerkaufrufe, externe Daten) sind nicht verfügbar
- Benutzerdefinierte Symbole (Cross-Asset-Spreads, synthetische Instrumente) erfordern eine manuelle Einrichtung
Quellen
Verwandte Volity-Trading-Tools
- Trading-Tools auf Volity: Übersicht
- Krypto-Copy-Trading: Spiegeln Sie geprüfte Trader
- Krypto-Trading-Signale: Kuratierte Kauf- und Verkaufsempfehlungen
- Automatisierter Handel: EAs, Bots und die API
- Volity MT: Krypto-Trading-Plattform
Häufig gestellte Fragen
Welches Charting bietet Volity für den Krypto-Handel?
Volity MT integriert die Charting-Engine von TradingView direkt. Sie erhalten über 100 technische Indikatoren, benutzerdefiniertes Pine Script, Ansichten für mehrere Zeitrahmen, Zeichenwerkzeuge und Chart-basierte Ordererteilung. Dieselben Charts funktionieren auf Mobilgeräten, Desktop und Web mit vollständiger Synchronisierung.
Ist die TradingView-Integration kostenlos?
Ja. Das TradingView-Charting ist in Ihrem Volity-Konto ohne zusätzliche Kosten enthalten. Dieselbe Engine, die TradingView.com antreibt, läuft innerhalb von Volity MT. Es ist kein separates TradingView-Abonnement erforderlich, um das integrierte Charting zu nutzen.
Kann ich Pine Script auf Volity verwenden?
Ja. Pine Script wird innerhalb der TradingView-Ebene von Volity MT unterstützt. Sie können Skripte aus der öffentlichen Bibliothek von TradingView verwenden, eigene einfügen oder benutzerdefinierte Indikatoren schreiben. Skripte, die auf TradingView.com funktionieren, funktionieren auch in Volity MT.
Funktionieren Volity-Charts auf Mobilgeräten?
Ja. Die Volity Mobile App (iOS und Android) enthält die vollständige Charting-Ebene mit denselben Indikatoren, Zeichenwerkzeugen und Synchronisierung. Charts, die auf dem Smartphone geöffnet werden, entsprechen in Echtzeit den Charts auf dem Desktop.
Kann ich Trades direkt aus dem Chart platzieren?
Ja. Drei Methoden: Rechtsklick auf ein Preisniveau und Kaufen/Verkaufen wählen, vom aktuellen Preis auf Ziel/Stop ziehen, um Orders zu setzen, oder das Order-Ticket in der Seitenleiste verwenden. Orders werden im Chart als verschiebbare Linien angezeigt.
Wie hoch ist die Latenz bei Volity-Charts?
Die typische WebSocket-Latenz von Tick bis zur Darstellung liegt unter 50ms. Dieselbe Ausführungs-Engine, die Ihre Orders ausführt, speist die Chart-Preise, sodass der angezeigte Kurs innerhalb der üblichen Slippage-Toleranz mit dem Ausführungskurs übereinstimmt.
Sind Krypto-Charts rund um die Uhr verfügbar?
Ja, für Krypto-Paare. Volity chartet Krypto rund um die Uhr, passend zum zugrunde liegenden Markt. Forex-Charts folgen den Forex-Handelszeiten (Sonntag 22:00 GMT bis Freitag 22:00 GMT). Rohstoff-, Index- und Aktien-Charts folgen ihren jeweiligen Marktzeiten.


