Quick answer
Crypto trading charts plot a coin’s price over time and are the basis of technical analysis. Candlestick charts are the most popular, showing the open, high, low and close for each period. Reading charts alongside trend lines, support and resistance, volume and indicators helps traders time entries and exits. On Volity, charts are powered by TradingView.
Crypto trading charts on Volity MT integrate TradingView’s charting engine directly into the trading interface. You get 100+ technical indicators, custom drawing, Pine Script for custom indicators, multi-timeframe views, and order-from-chart execution. Charts sync across mobile, desktop, and web. This page covers the charting capabilities and how to use them.
Crypto trading charts on Volity: what you get
TradingView engine inside Volity MT. Not a separate app; the chart panel in Volity MT is TradingView. This means:
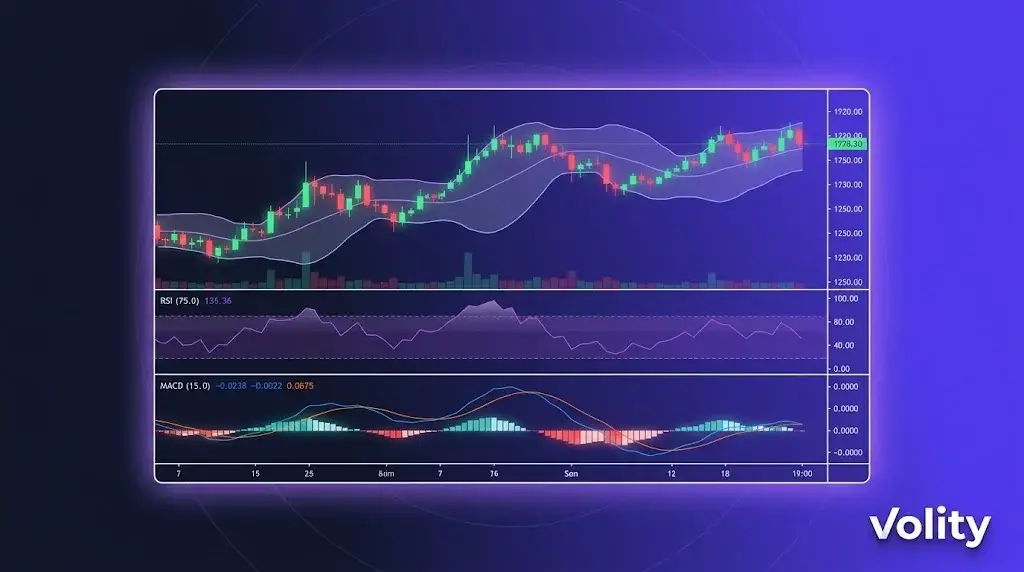
- 100+ built-in technical indicators (RSI, MACD, Bollinger Bands, Ichimoku, Volume Profile, etc.)
- Custom indicators via Pine Script
- Multi-timeframe views (open the same pair on 1m, 5m, 1h, 4h, daily simultaneously)
- Drawing tools (trendlines, Fibonacci, Elliott waves, volume profile zones)
- Smart drawings that auto-extend across timeframes
- Chart-based order entry (click a price level to place an order)
Real-time data behind crypto trading charts
Live tick data on all 20+ crypto pairs plus forex, indices, stocks, commodities. The same execution engine that fills your orders feeds the chart prices, so the displayed quote matches what your order will fill against (within standard slippage tolerance).
WebSocket-based streaming with sub-50ms latency from quote update to chart render. Bandwidth-optimised for cellular connections on mobile.
Multi-timeframe top-down workflow
A common workflow combining multiple timeframes:
“ 1. Daily chart: identify the trend (uptrend, downtrend, range) 2. 4-hour chart: find a setup within the trend (pullback, breakout, reversal) 3. 1-hour chart: refine entry timing on the setup 4. 15-minute chart: time entry within the hour 5. Order ticket: place trade with stop and target from the 4-hour level “
Volity MT supports this workflow with synchronised crosshair, indicator settings that persist across timeframes, and the ability to drop the same pair on multiple panels with different timeframes.
Indicators worth learning
Five indicators that cover most retail technical analysis:
1. Moving Averages (MA, EMA). Trend identification. 50 and 200 are the standard institutional levels.
2. RSI (Relative Strength Index). Momentum and overbought/oversold. Classic 70/30 thresholds; 80/20 for stronger signals.
3. MACD. Trend changes and momentum shifts. Crossover signals are common entry triggers.
4. Bollinger Bands. Volatility expansion/contraction. Range-fade traders use band touches; breakout traders use band exits.
5. Volume Profile. Where most volume traded at each price level. Identifies support/resistance zones with higher reliability than horizontal lines.
100+ more indicators are available; these five are the foundation most retail strategies build on.
Pine Script for custom indicators
If a built-in indicator does not fit your strategy, Pine Script lets you build custom ones. Pine is TradingView’s scripting language, designed for technical analysis.
Common custom-Pine use cases: – Combine multiple indicators into a single composite signal – Add alerts on specific multi-condition setups – Backtest a strategy visually on historical data – Create custom plots (e.g., relative strength of one asset vs another)
Pine Script knowledge transfers across platforms, scripts written for TradingView work in Volity MT’s charting layer.
Chart-based order entry
Three ways to place orders from the chart:
1. Click a price level. Right-click any price on the chart and select “Buy at this level” or “Sell at this level” to set a limit order. The order persists on the chart as a horizontal line you can drag.
2. Drag-to-place orders. With one-click trading enabled, drag from the current price to a target price to set a take-profit. Drag to a stop level to set the stop.
3. Order panel sidebar. Standard order ticket alongside the chart, with size, leverage, stop, and target inputs.
Chart sync across devices
Charts, indicators, drawings, and watchlists sync across Volity MT mobile (iOS, Android), desktop (Windows, Mac), and web. Open the same chart layout on your phone that you closed on desktop. Drawings persist; alerts persist.
Alerts
Set chart-based alerts on:
- Price levels (above/below)
- Indicator crossovers (e.g., RSI crosses 70)
- Drawing-tool touches (e.g., price hits trendline)
- Custom Pine Script conditions
Alerts deliver via in-app notification, push notification (mobile), email, and (on VIP) webhook to your own systems.
Limitations
- Chart history depth varies by instrument: 5-10 years on major forex and crypto pairs; less on tail altcoins
- Pine Script execution is sandboxed; some advanced features (network calls, external data) are unavailable
- Custom symbols (cross-asset spreads, synthetic instruments) require manual setup
Sources
Related Volity trading tools
- Trading Tools on Volity: Overview
- Crypto Copy Trading: Mirror Vetted Traders
- Crypto Trading Signals: Curated Buy and Sell Calls
- Automated Trading: EAs, Bots, and the API
- Volity MT: Crypto Trading Platform
Frequently asked questions
What charting does Volity offer for crypto trading?
Volity MT integrates TradingView’s charting engine directly. You get 100+ technical indicators, custom Pine Script, multi-timeframe views, drawing tools, and chart-based order entry. The same charts work on mobile, desktop, and web with full sync.
Is the TradingView integration free?
Yes. TradingView charting is included with your Volity account at no extra cost. The same engine that powers TradingView.com runs inside Volity MT. There is no separate TradingView subscription required to use the integrated charting.
Can I use Pine Script on Volity?
Yes. Pine Script is supported inside Volity MT’s TradingView layer. You can use scripts from TradingView’s public library, paste your own, or write custom indicators. Scripts that work on TradingView.com work in Volity MT.
Do Volity charts work on mobile?
Yes. The Volity mobile app (iOS and Android) includes the full charting layer with the same indicators, drawing tools, and sync. Charts opened on mobile match charts opened on desktop in real time.
Can I place trades directly from the chart?
Yes. Three methods: right-click a price level and select buy/sell, drag from current price to target/stop to set orders, or use the side-panel order ticket. Orders persist on the chart as draggable lines.
What is the latency on Volity charts?
Typical WebSocket tick-to-render latency is sub-50ms. The same execution engine that fills your orders feeds chart prices, so the displayed quote matches the fill quote within standard slippage tolerance.
Are crypto charts available 24/7?
Yes for crypto pairs. Volity charts crypto 24/7 to match the underlying market. Forex charts follow forex hours (Sunday 22:00 GMT to Friday 22:00 GMT). Commodity, index, and stock charts follow their respective market hours.