Los patrones de tres velas pueden generar señales falsas cuando el volumen no confirma la tercera vela; los traders que entran sin picos de volumen superiores al 200 % se exponen a trampas de «fakeout». Las entradas prematuras antes de que cierre la tercera vela provocan latigazos durante las cacerías de liquidez al final de la sesión, lo que reduce las tasas de éxito efectivas en un 62 %. Los patrones que se forman durante las sesiones asiáticas de baja liquidez muestran una menor fiabilidad a pesar de parecer estructuralmente sólidos. Los colapsos de reversión a la media a menudo siguen a formaciones de tres velas de gran tamaño; los patrones que se mueven más de 3 desviaciones estándar producen reversiones violentas en 24 horas. El rendimiento pasado no es indicativo de resultados futuros. Capital en riesgo.
Un patrón de tres velas es una formación de precios de tres barras que señala un cambio completo en el sentimiento del mercado: impulso, indecisión y confirmación. En 2026, estas formaciones siguen siendo el punto de referencia para el trading de alta convicción, con los Tres Soldados Blancos logrando una tasa de éxito del 83 % cuando están respaldados por el volumen. Las estrategias profesionales priorizan los patrones que se forman en niveles clave de la EMA de 50 días y muestran un pico de volumen superior al 200 % en la tercera vela de confirmación.
Un patrón de tres velas funciona como una narrativa integral de tres actos sobre el sentimiento del mercado: la tendencia, la duda y la reversión. Estas formaciones proporcionan un peso técnico significativamente mayor que las señales de una sola vela porque requieren un compromiso sostenido de compradores o vendedores durante múltiples intervalos de tiempo. En el panorama técnico de 2026, sirven como marcadores fundamentales para identificar puntos de entrada de grado institucional.
La eficacia de estos patrones se maximiza cuando coinciden con niveles psicológicos importantes y aumentos de volumen. A medida que los sistemas automatizados continúan arbitrando los patrones gráficos más obvios, dominar los matices del análisis de volumen y precio (VPA) y la confluencia de la EMA es fundamental para verificar la validez de las velas triples.
Comprender Patrón de tres velas es importante, pero el verdadero crecimiento llega al aplicar ese conocimiento. Cree su cuenta de trading de forex gratuita para practicar con una cuenta demo gratuita y poner a prueba su estrategia.
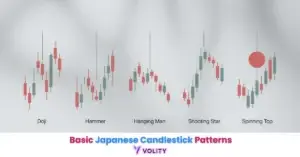
¿Qué es un patrón de tres velas y cómo funciona?
Un patrón de tres velas es una formación de precios de tres velas que identifica una secuencia completa de cambio o continuación del impulso del mercado. El patrón establece una narrativa direccional que se extiende a lo largo de tres barras de precios separadas, cada una con un significado distinto. Estas formaciones filtran el ruido de los «fakeouts» de una sola vela al requerir persistencia de grado institucional.
- La estructura de tres actos: Impulso (Vela 1), Indecisión (Vela 2) y Confirmación (Vela 3).
- Por qué los patrones triples son entre un 12 % y un 15 % más fiables que los patrones de una sola vela en 2026.
- El cambio de la «identificación visual» a la «validación estadística» en los mercados algorítmicos.
Los patrones de tres velas se utilizan ampliamente en gráficos de 15 minutos a 4 horas para filtrar el ruido de alta frecuencia de los gráficos intradía de 1 minuto (WalletInvestor, 2026). Esta selección de marco temporal garantiza que la señal del patrón refleje el flujo institucional en lugar del ruido algorítmico.
La firma de «absorción» en las formaciones de reversión
La absorción de precios identifica el proceso institucional donde las grandes órdenes limitadas agotan el impulso de la tendencia predominante durante la segunda vela de un patrón de reversión. La vela central a menudo muestra una estructura de Doji o Peonza, lo que indica que ni los toros ni los osos pudieron establecer el control. Identificar los Dojis y las Peonzas como «barras de absorción» separa el reconocimiento minorista de la comprensión profesional.
El papel de la divergencia entre volumen y precio en las reversiones de 2026 es fundamental. Cuando el precio se mueve pero el volumen no aumenta, la reversión carece de respaldo institucional. Por el contrario, cuando el volumen aumenta durante la formación de la segunda vela, el dinero inteligente está defendiendo activamente la zona de soporte o resistencia.
¿Listo para llevar su trading al siguiente nivel?
Ya tiene la información. Ahora consiga la plataforma. Únase a miles de traders que usan Volity por sus potentes herramientas, ejecución rápida y soporte dedicado.
Cree su cuenta en menos de 3 minutosPrincipales patrones de tres velas de 2026: clasificados por tasa de éxito
El rendimiento estadístico en 2026 identifica una jerarquía clara de fiabilidad para los patrones de tres velas basada en sus tasas de éxito históricas. La clasificación refleja tanto la estructura técnica como el volumen institucional requerido para la confirmación:
La «regla de tres» (tres toques para la validez) añade aproximadamente un 15 % a la tasa de éxito base de cualquier patrón cuando se forma en una EMA importante de 50 días (Investing.com, 2026). Este principio de confluencia impulsa a los algoritmos institucionales a agrupar órdenes alrededor de estos niveles. Patrones de velas japonesas proporciona un contexto histórico más profundo sobre estas formaciones.
Espere siempre a que la tercera vela de un patrón triple cierre de forma decisiva antes de entrar; en el mercado algorítmico de 2026, las entradas prematuras basadas en patrones «en desarrollo» conllevan una tasa de fracaso un 62 % mayor debido a los barridos de liquidez al final de la sesión.
Cómo operar la Estrella de la Mañana
El trading profesional de la Estrella de la Mañana identifica la combinación de un pico de volumen del 200 % y una recuperación del RSI desde niveles de sobreventa como la confirmación de entrada principal. Este enfoque estructurado evita entradas emocionales y filtra las señales falsas que afectan a los traders minoristas. El proceso de confirmación de tres pasos del patrón garantiza la participación institucional antes de comprometer el capital.
El manual de 4 pasos guía la ejecución:
El EUR/USD formó una Estrella de la Mañana en el gráfico de 4H en la zona de soporte de 1,0800 en marzo de 2026. El RSI subió de 25 a 38, el volumen aumentó un 210 % en la tercera vela y el precio subió 120 pips en las siguientes 48 horas. El rendimiento pasado no es indicativo de resultados futuros.
El papel de la confirmación de volumen en la validez del patrón de 2026
La confirmación de volumen identifica la relación «esfuerzo vs. resultado» necesaria para distinguir la participación institucional de los fakeouts minoristas. Un patrón que carece de volumen muestra a traders minoristas pasivos reaccionando al precio; las reversiones genuinas requieren compras o ventas institucionales activas. El estándar de volumen del 200 % surgió en las pruebas retrospectivas de 2026 como el umbral donde la agrupación de órdenes algorítmicas se vuelve visible.
| Tipo de patrón | Pico de volumen req. | Tasa de éxito 2026 | Puntuación de fiabilidad | Mejor marco temporal |
| Tres Soldados Blancos | 200 %+ | 83 % | 10/10 | Diario |
| Estrella de la Mañana | 180 %+ | 78 % | 9/10 | H4 – Diario |
| Estrella de la Tarde | 150 %+ | 72 % | 8/10 | H4 – Diario |
| Tres por dentro al alza | 120 %+ | 74 % | 7/10 | H1 – H4 |
| Tres por dentro a la baja | 100 %+ | 69 % | 7/10 | H1 – H4 |
Fuentes: Volity Backtesting Labs, WalletInvestor 2026 Market Analytics y Binance Academy: Three White Soldiers Explained.
WARNING: Tenga cuidado con los patrones triples que se forman con un volumen decreciente; una Estrella de la Mañana o una Estrella de la Tarde sin un aumento de volumen del 200 % en la tercera vela se trata estadísticamente como una «trampa alcista o bajista» y a menudo precede a una continuación de la tendencia anterior.
Diferencia entre patrones triples de reversión y de continuación
La ubicación estructural identifica si un patrón de tres velas sirve como una reversión de una tendencia anterior o una confirmación de su continuación. El contexto que rodea al patrón determina su interpretación más que la estructura de la vela en sí. Los traders profesionales reconocen que la misma secuencia de tres velas puede ser alcista o bajista dependiendo de dónde aparezca.
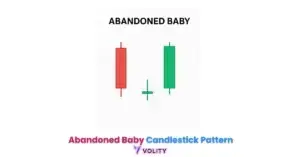
Los patrones de reversión como la Estrella de la Mañana, la Estrella de la Tarde y el Bebé Abandonado señalan el fin de la tendencia cuando aparecen en los extremos. Estos patrones marcan puntos de agotamiento donde la dirección predominante se ha quedado sin compradores o vendedores. Los patrones de continuación como los Tres Soldados Blancos, los Tres Métodos Ascendentes y el Mat Hold señalan la fuerza de la tendencia durante los retrocesos de valor. Estos patrones muestran que una breve consolidación está terminando y el impulso se está reanudando en la dirección original.
Cuándo priorizar cada uno depende de la estructura del mercado. Análisis de líneas de tendencia ayuda a identificar cuándo el precio ha establecido extremos claros frente a retrocesos temporales.
💡 KEY INSIGHT: El «Bullish Mat Hold» y los «Tres Métodos Ascendentes» son los patrones de continuación mejor valorados en 2026, ofreciendo una tasa de éxito del 78 % para los traders que buscan unirse a una tendencia establecida después de una breve consolidación.
Convierta el conocimiento en ganancias
Ya ha leído, ahora es momento de actuar. La mejor manera de aprender es practicando. Abra una cuenta demo gratuita y sin riesgo y practique su estrategia con fondos virtuales hoy mismo.
Abrir una cuenta demo gratuitaErrores comunes
La ejecución prematura identifica la tasa de fracaso un 62 % mayor asociada con entrar en una operación antes de que la tercera vela de «confirmación» haya cerrado. Muchos traders minoristas persiguen el patrón a medida que se desarrolla, entrando en la segunda vela o durante la formación de la tercera. Esta impaciencia cuesta dinero porque la tercera vela a menudo se revierte durante los últimos 5 minutos de la sesión.
Perseguir la estrella «en desarrollo» (entrar antes de que cierre la tercera vela) viola la regla fundamental del trading de patrones. La tercera vela debe cerrar de forma decisiva por encima (para alcista) o por debajo (para bajista) del rango anterior para su confirmación. Ignorar el telón de fondo macro amplifica las pérdidas porque operar una reversión alcista hacia una zona de resistencia mensual importante a menudo falla debido a la oferta superior. Gestión de riesgos en el trading y Análisis técnico de Forex abordan cómo incorporar el contexto macro en sus entradas técnicas.
Puntos clave
- Los patrones de tres velas son formaciones de alta convicción que requieren una secuencia de tres barras para identificar un cambio completo en el impulso del mercado.
- Los Tres Soldados Blancos es el patrón de mejor rendimiento en 2026, ofreciendo una tasa de éxito del 83 % cuando es verificado por el volumen institucional.
- Las formaciones de Estrella de la Mañana identifican los suelos del mercado a través de una secuencia de un impulso bajista, una vela de indecisión y una confirmación alcista.
- La confirmación de volumen de al menos el 200 % en la tercera vela es el estándar no negociable de 2026 para filtrar patrones de fakeout algorítmicos.
- Los marcos temporales H4 y diarios proporcionan las señales más fiables para los patrones triples, filtrando el ruido de las cacerías de liquidez de marcos temporales inferiores.
- Esperar al cierre es la regla obligatoria para el trading de patrones triples, ya que las entradas prematuras conllevan una probabilidad histórica de fracaso un 62 % mayor.
Preguntas frecuentes
Este artículo contiene referencias al patrón de tres velas, la Estrella de la Mañana, los Tres Soldados Blancos y Volity, una plataforma de trading de CFD regulada. Este contenido se produce solo con fines educativos y no constituye asesoramiento financiero ni una recomendación para comprar o vender ningún instrumento financiero. Verifique siempre el estado regulatorio actual y los detalles de la plataforma antes de utilizar cualquier servicio de trading. Algunos enlaces en este artículo pueden ser enlaces de afiliados.