Choosing the right Forex trading time frame is one of the most critical decisions a trader makes. It defines the rhythm and context of your trades, influencing your strategy, risk management, and even your trading psychology. Each candlestick on your chart tells a story, and the time frame determines whether that story is a sentence, a paragraph, or a chapter.
This guide explains the most popular Forex time frames in 2025, how to choose the right one for your style, and how to combine them for more powerful analysis.
What is a Time Frame in Forex Trading?
A Forex time frame is the period each candlestick or bar on a chart represents, such as 1 minute (M1), 1 hour (H1), or 1 day (D1). It defines the specific interval of price action that traders see and analyze.
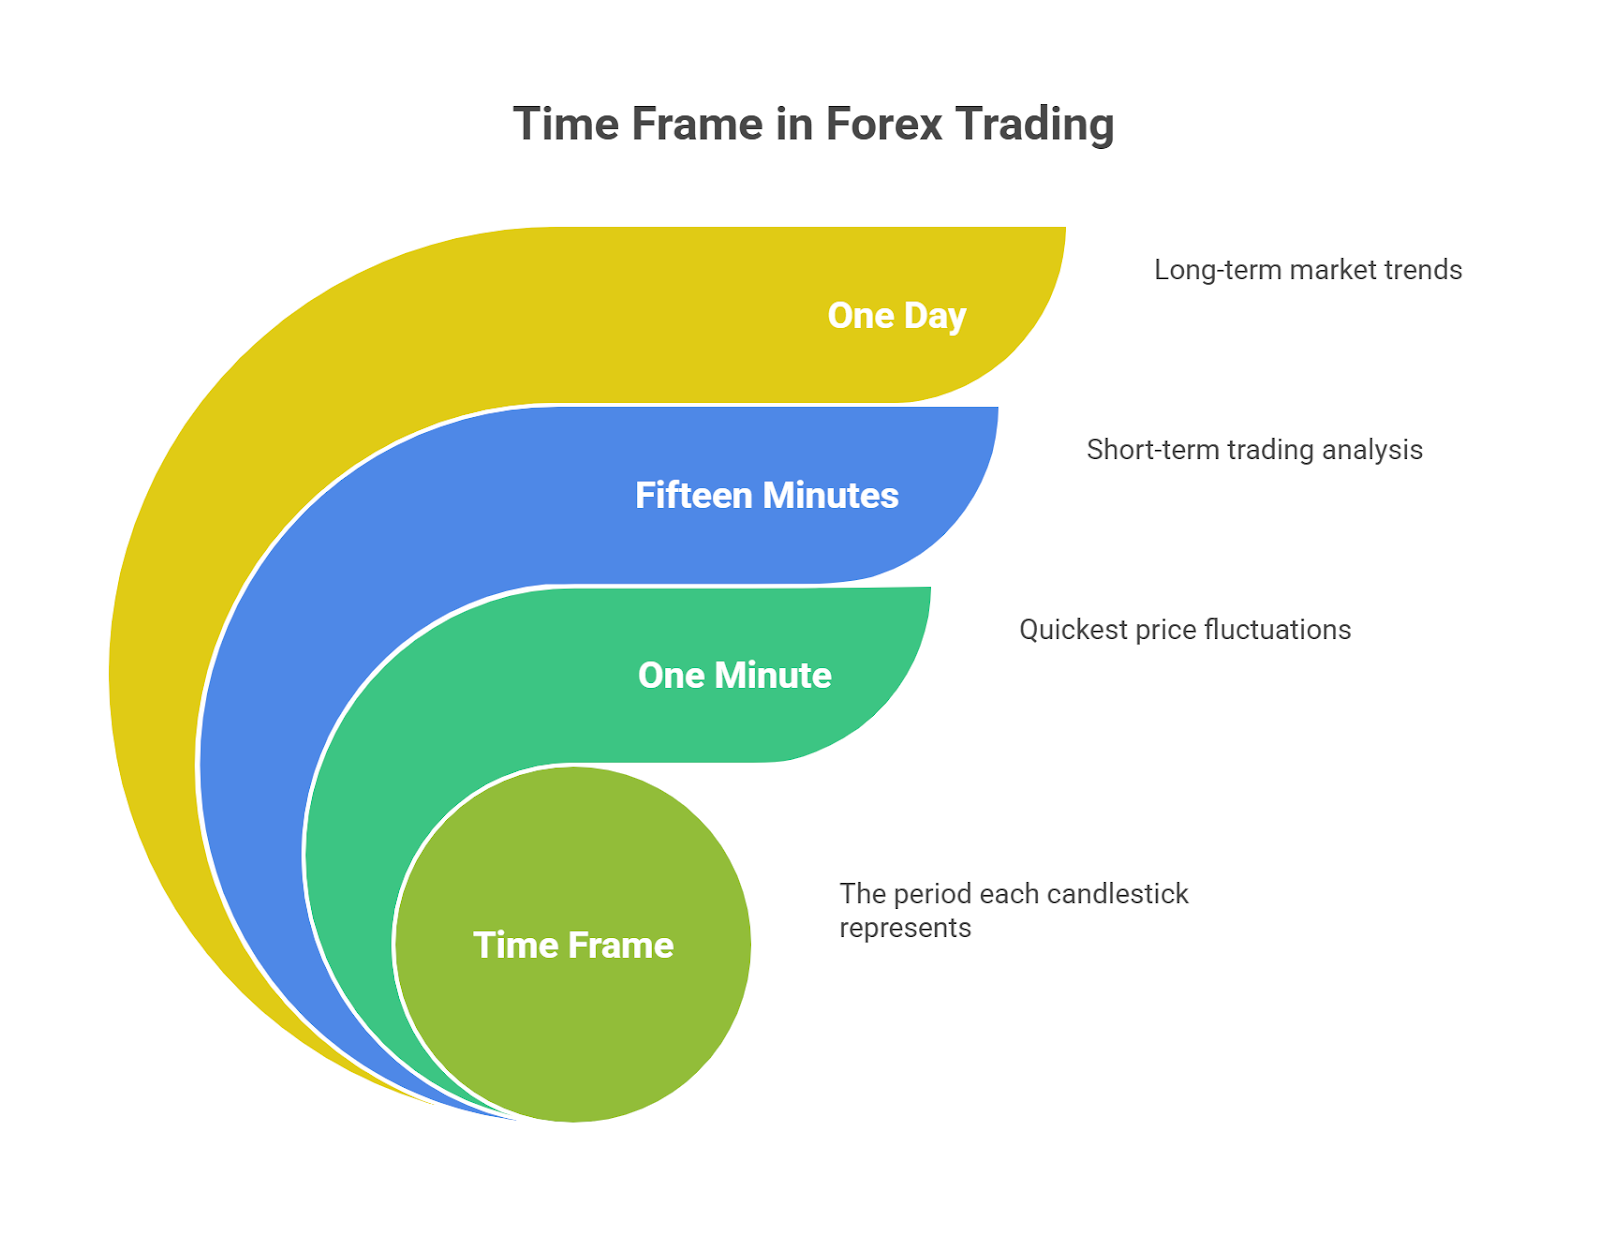
When you select a time frame, you are choosing how much data is condensed into a single candle. A 1-hour time frame shows the open, high, low, and close prices for every 60-minute period. A daily time frame shows the same for an entire 24-hour session. This choice dictates the level of detail and the speed of the trading environment.
Types of Forex Time Frames
Different time frames are suited for different trading styles, from fast-paced scalping to long-term investing.
| Trading Style | Associated Time Frames | Goal |
| Scalping | M1, M5, M15 | To capture very small, rapid price movements (pips). |
| Day Trading | M15, M30, H1 | To open and close trades within a single trading day. |
| Swing Trading | H4, D1 | To hold trades for several days to weeks to capture a “swing” in price. |
| Position Trading | W1, MN1 (Monthly) | To hold trades for several weeks, months, or even years. |
Common Forex Time Frames & How They Work
M1 and M5 Time Frames (Scalping)
- Who Uses It: Scalpers who execute dozens of trades per day.
- Pros: Offers the maximum number of trading opportunities.
- Cons: Full of market noise, high transaction costs due to frequent trading, and requires intense focus.
- Example Strategy: A scalper on the M1 chart might use a fast-moving average to enter a trade for a 5-10 pip profit.
M15 Time Frame (Intraday Precision)
- Who Uses It: Day traders looking for more detail to time their entries and exits.
- Pros: Filters out some of the noise from M1/M5 charts while still providing plenty of intraday signals.
- Cons: Can still be susceptible to false signals during choppy market conditions.
H1 Time Frame (Day Trading)
- Who Uses It: The classic time frame for day traders.
- Pros: Provides a clear view of the day’s price action, trends, and key levels without the noise of lower time frames.
- Cons: Fewer trading opportunities compared to scalping charts.
- Example Strategy: A day trader might use the H1 chart to identify the intraday trend and enter a trade that they plan to close before the end of the session.
H4 Time Frame (Swing Trading)
- Who Uses It: Swing traders and traders who cannot monitor charts all day.
- Pros: Offers a great balance between a “big picture” view and actionable trade signals. Signals are generally more reliable than on lower time frames.
- Cons: Requires more patience and wider stop-losses.
- Example Strategy: A swing trader on the H4 chart might identify a pullback within a larger trend and hold the position for several days.
Daily Time Frame (Macro View)
- Who Uses It: Swing traders and long-term investors.
- Pros: Provides a powerful view of the primary market trend, filtering out almost all intraday noise. Levels of support and resistance are very significant.
- Cons: Trade signals are infrequent, sometimes occurring only a few times per month.
Weekly and Monthly Time Frames (Position Traders)
- Who Uses It: Position traders and institutional investors.
- Pros: The ultimate “big picture” view, ideal for analyzing long-term economic trends. Signals are extremely strong.
- Cons: Requires immense patience and very wide stop-losses.
Forex Time Frame Comparison
| Time Frame | Trader Type | Best For | Weakness |
| M1, M5 | Scalper | High-frequency trading | High market noise, stressful |
| H1 | Day Trader | Intraday trend analysis | Fewer signals than M1/M5 |
| H4 | Swing Trader | Balancing detail & macro view | Requires wider stops |
| D1, W1 | Position Trader | Identifying long-term trends | Very infrequent signals |
How to Choose the Right Forex Time Frame
The best time frame for you depends on your personality, lifestyle, and trading goals. Ask yourself these questions:
- How much screen time can I commit? If you have a full-time job, lower time frames like M1 or M5 are impractical. H4 or Daily charts, which only need to be checked a few times a day, are more suitable.
- How quickly do I make decisions? Scalping requires instant decisions under pressure. If you prefer to analyze and plan your trades without rush, a higher time frame like H4 or D1 is a better fit for your risk profile.
- What are my profit goals? Are you aiming to make many small profits (scalping) or fewer, larger profits (swing/position trading)? Your goal will dictate your time frame.
Multi-Time Frame Analysis (Time Frame Alignment)
Multi-time frame analysis is the process of using higher time frames to define the primary trend and lower time frames to pinpoint precise entries and exits.
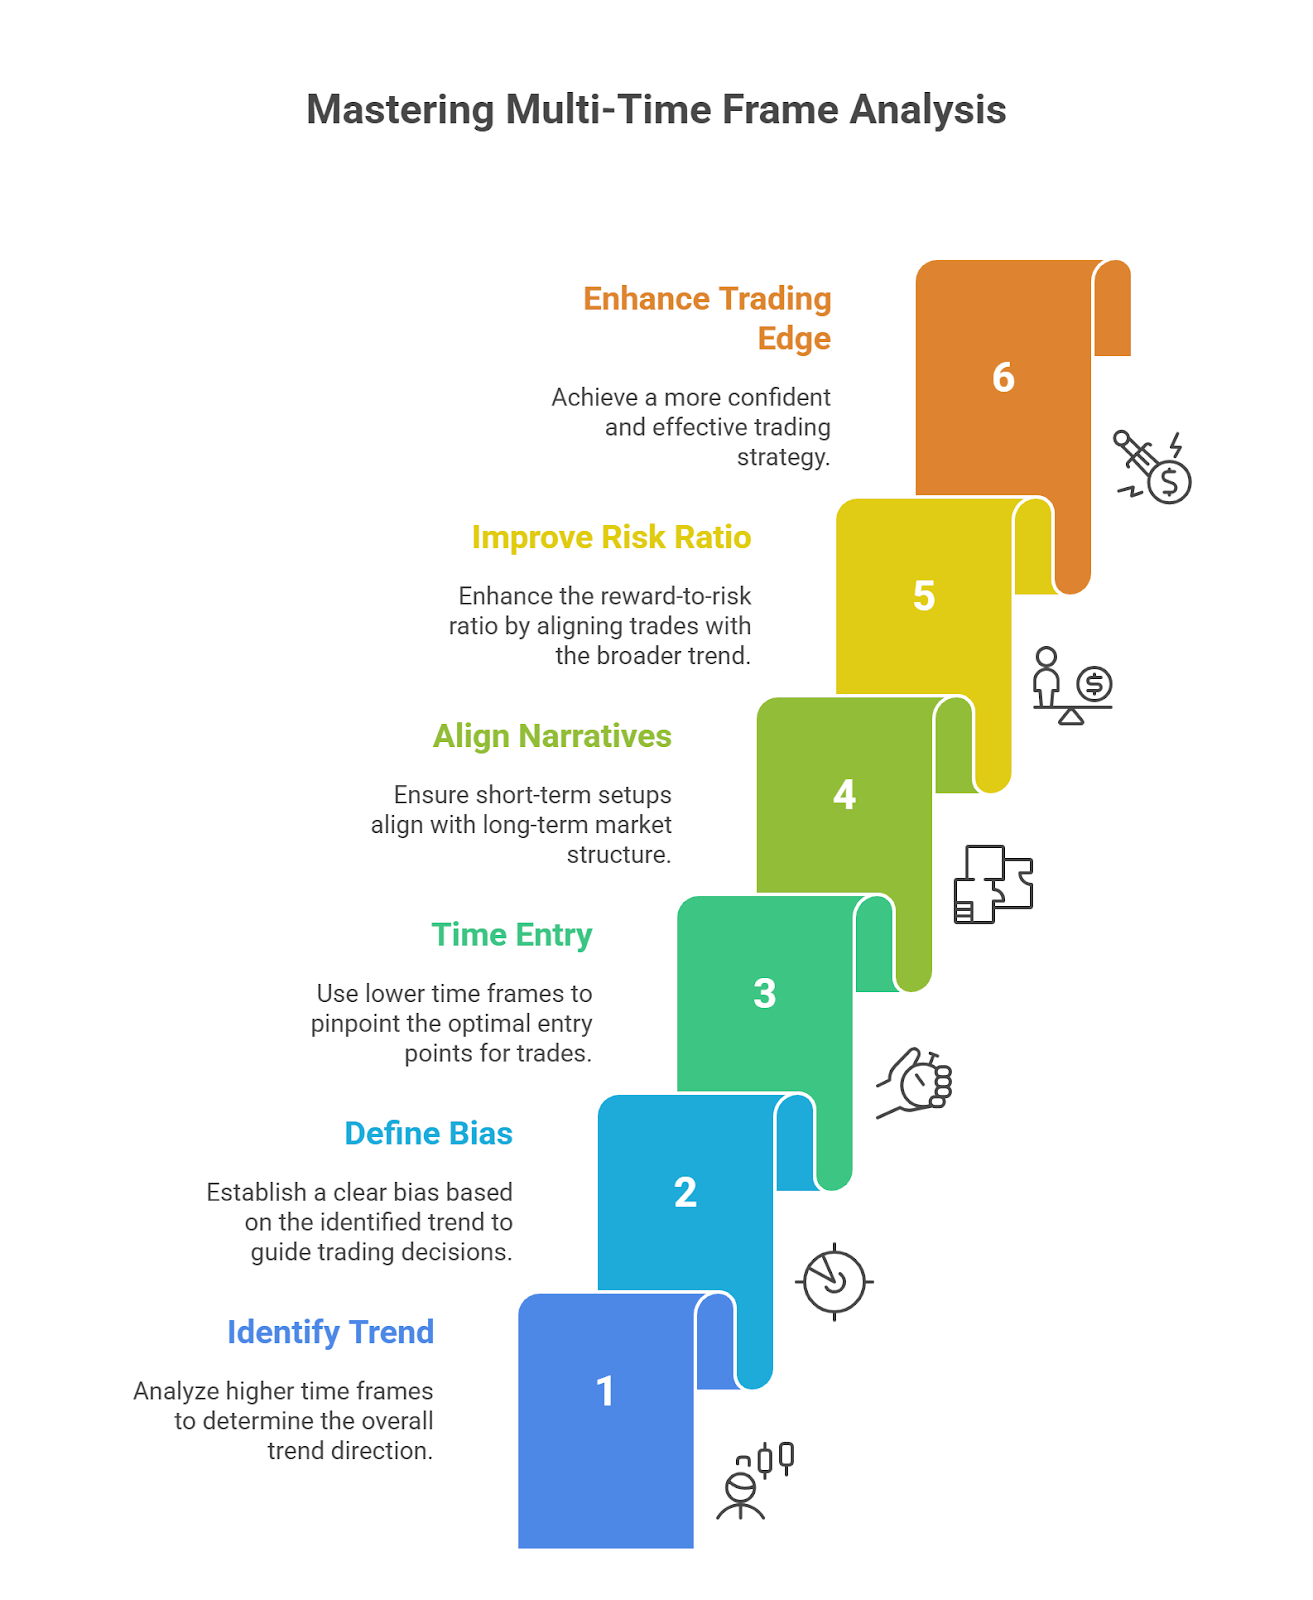
This technique ensures you are trading with the dominant market momentum, not against it.
A Common Workflow (The Top-Down Approach):
- Identify the Primary Trend (Daily Chart): Start with the daily chart to determine the overall market direction. Is it in an uptrend, downtrend, or range?
- Find Key Levels (H4 Chart): Drop down to the 4-hour chart to identify key support and resistance levels, chart patterns, and potential entry zones that align with the daily trend.
- Time Your Entry (H1 Chart): Use the 1-hour chart to fine-tune your entry. Wait for a specific confirmation signal, such as a candlestick pattern or an indicator crossover, before executing the trade.
Common Mistakes When Choosing Time Frames
- Overtrading on Low Time Frames: Beginners are often drawn to M1/M5 charts because of the constant action, but this often leads to overtrading based on market noise rather than clear signals.
- Ignoring the Bigger Picture: A common mistake is seeing a buy signal on an M15 chart without checking the H4 or Daily chart, only to find you are trading directly against a powerful, dominant downtrend.
- Misalignment with Lifestyle: A person with a demanding job trying to scalp during their lunch break is a recipe for stress and poor decisions. Your time frame must fit your schedule.
Bottom Line
Choosing a trading time frame is about finding the rhythm and context that best fits your strategy and personality. There is no single “best” time frame, only the one that is best for you.
The key to success is to test different time frames on a demo account, journal your results, and refine your approach. By finding a time frame that aligns with your lifestyle and allows you to make calm, analytical decisions, you build a solid foundation for your Forex trading strategy.