Les signaux Shooting Star n’atteignent une fiabilité de 60-65 % que lorsqu’ils se forment à des niveaux de résistance ; les faux signaux sont fréquents sur les unités de temps inférieures. Les bougies de confirmation doivent clôturer sous la figure pour être valides, mais les retournements de marché peuvent échouer rapidement. L’effet de levier amplifie les pertes liées aux retournements manqués. Les performances passées ne préjugent pas des résultats futurs. Capital à risque.
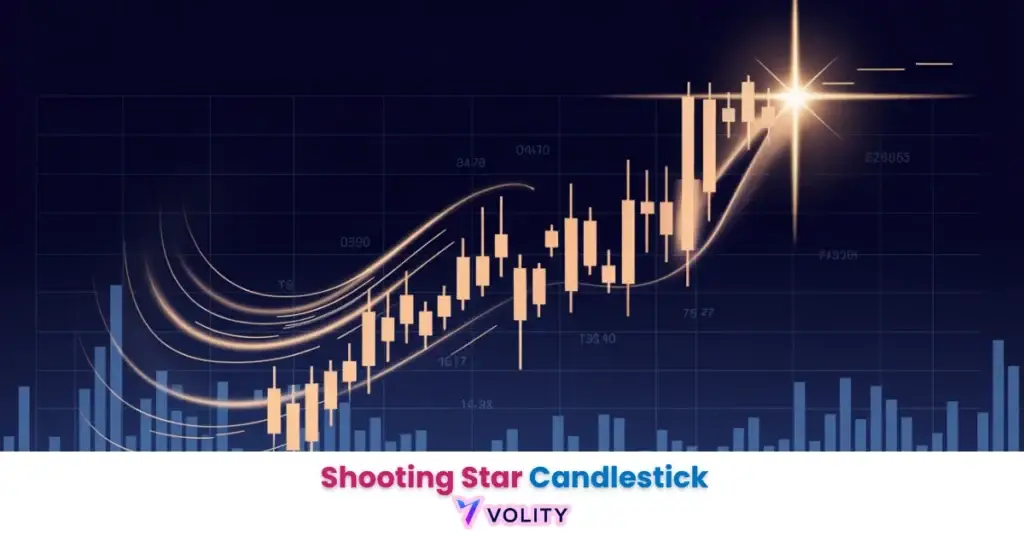
Le Shooting Star est une figure de retournement baissier en chandelier japonais caractérisée par un petit corps situé dans la partie basse de la plage de variation, avec une mèche supérieure étendue, signalant un épuisement des acheteurs au niveau d’une résistance. En 2026, les Shooting Stars situés à des niveaux de résistance majeurs atteignent une précision de retournement de 60-70 % lorsqu’ils sont confirmés par la clôture plus basse de la bougie suivante. Cette figure identifie le moment précis où les vendeurs prennent le dessus sur les acheteurs après une tendance haussière prolongée.
Le Shooting Star fonctionne comme l’inverse du chandelier Hammer, identifiant le moment précis où les acheteurs s’épuisent au niveau d’une résistance. La mèche supérieure étendue représente une tentative de momentum haussier qui s’est inversée brutalement au cours de la même séance, indiquant un fort rejet des prix plus élevés. Cette figure apparaît à la fin des tendances haussières, marquant des points de retournement potentiels.
L’environnement de trading de 2026 produit fréquemment des Shooting Stars au niveau des résistances algorithmiques où les traders institutionnels placent leurs ordres de vente. Reconnaître ces figures permet aux traders de sortir de leurs positions longues avant que des retournements majeurs ne se produisent.
Comprendre Forex est important, mais la vraie progression commence en appliquant ces connaissances. Créez votre compte de trading forex gratuit pour vous entraîner sur un compte démo gratuit et mettre votre stratégie à l’épreuve.
Qu’est-ce qu’une figure en chandelier Shooting Star ?
Un Shooting Star est une figure de retournement baissier avec un petit corps positionné dans la partie basse de la plage de la bougie et une longue mèche supérieure représentant au moins 2-3 fois la hauteur du corps.
La figure se forme lorsque le prix grimpe brusquement au cours de la séance mais clôture près de l’ouverture, démontrant que les acheteurs étaient agressifs au départ mais que les vendeurs ont repris le contrôle avant la clôture. La longue mèche supérieure indique des niveaux de support, créant un rejet des prix plus élevés. Les Shooting Stars doivent se former à des niveaux de résistance pour signaler de véritables retournements baissiers ; les Shooting Stars se formant au milieu d’une plage de variation n’ont qu’un taux de succès de 45 %.
La validité de la figure nécessite : (1) un petit corps, (2) une longue mèche supérieure (2-3 fois la hauteur du corps), (3) une formation au niveau ou près d’une résistance, (4) une confirmation par la bougie suivante clôturant plus bas.
Prêt à faire passer votre trading au niveau supérieur ?
Vous avez les connaissances. Il vous manque la plateforme. Rejoignez des milliers de traders qui choisissent Volity pour ses outils puissants, son exécution rapide et son support dédié.
Créez votre compte en moins de 3 minutesComment identifier un Shooting Star au niveau d’une résistance ?
Les Shooting Stars situés à des niveaux de résistance horizontaux majeurs ou sur une ligne de tendance atteignent une précision de retournement de 65-70 %. Recherchez la formation de la figure exactement au niveau des précédents sommets ou des chiffres ronds où se concentrent les ordres de vente institutionnels.
Les Shooting Stars situés à des niveaux de support au sein de tendances haussières sont des figures de continuation, et non de retournement ; ils doivent être ignorés ou traités comme des rebonds. Le contexte, c’est-à-dire l’endroit où la figure se forme sur le graphique, détermine sa valeur prédictive. Un Shooting Star après une hausse de 200 pips à un niveau de résistance de 6 mois est très significatif ; un Shooting Star au milieu d’une plage après un mouvement de 30 pips n’est que du bruit.
Exemple de trading réel : le GBP/USD a grimpé jusqu’à 195,50 (résistance de 6 mois) et a formé un Shooting Star avec une mèche supérieure de 50 pips sur un volume 2,1 fois supérieur à la moyenne. La bougie suivante a clôturé 80 pips plus bas, confirmant le retournement. La tendance baissière s’est poursuivie sur 300 pips en 3 jours. Les performances passées ne préjugent pas des résultats futurs.
Un Shooting Star au corps rouge est statistiquement plus fort qu’un vert, indiquant que les vendeurs ont dominé toute la séance, y compris la clôture.
Quelle est la fiabilité des Shooting Stars par rapport aux Hammers ?
Les Shooting Stars et les Hammers atteignent tous deux une précision de 60-70 % aux niveaux clés de support et résistance avec confirmation. Les Shooting Stars apparaissent aux sommets lors des tendances haussières ; les Hammers apparaissent aux creux lors des tendances baissières. La fiabilité dépend de l’emplacement et de la confirmation, et non du type de figure en soi.
La confirmation par le volume compte tout autant pour les deux figures : un Shooting Star avec un volume doublé à une résistance est 30 % plus fiable qu’un Shooting Star avec un faible volume. Combiner les figures en chandelier avec la divergence des indicateurs (RSI ne parvenant pas à atteindre les sommets précédents, histogramme MACD en déclin) augmente la précision à plus de 75 %.
| Figure | Emplacement | Taux de succès | Biais de couleur | Confirmation |
| Hammer | Support | 70 % | Vert plus fort | Bougie suivante plus haute |
| Shooting Star | Résistance | 65 % | Rouge plus fort | Bougie suivante plus basse |
| Les deux | Niveau majeur | 72 % | Aligné avec la tendance | Volume + bougie |
Sources : Études sur les figures et recherches sur les chandeliers 2026
WARNING: Les Shooting Stars sans clôture de bougie de confirmation ne sont pas de véritables retournements ; beaucoup de Shooting Stars échoués repartent à la hausse, piégeant les vendeurs à découvert.
Comment trader les figures Shooting Star ?
Les entrées sur Shooting Star nécessitent d’attendre que la bougie de confirmation clôture entièrement sous le plus bas de la figure avant de vendre à découvert.
Vendez à la clôture de la bougie de confirmation si elle clôture sous le plus bas du Shooting Star, en plaçant le stop-loss 3-5 pips au-dessus de la mèche supérieure. Prendre ses profits à 1,5-2 fois la distance du risque permet de capturer 60-70 % de la baisse disponible avant que les retournements ne se produisent. Ne vendez jamais à découvert sur la bougie Shooting Star elle-même ; attendez la bougie suivante pour confirmer la poursuite du momentum baissier.
Placer des ordres de vente stop sous les Shooting Stars identifiés sur les graphiques journaliers permet des entrées automatisées lorsque la confirmation se produit, permettant aux traders de dormir pendant les sessions de Londres/New York tout en capturant les retournements asiatiques/européens.
💡 KEY INSIGHT: Les trades sur Shooting Star les plus efficaces se produisent lorsque la figure se forme sur des chiffres ronds (1,0950, 195,50) où les ordres de vente institutionnels se déclenchent automatiquement, créant des retournements auto-réalisateurs.
Transformez vos connaissances en profit
Vous avez lu, il est temps d’agir. La meilleure façon d’apprendre, c’est en pratiquant. Ouvrez un compte démo gratuit et sans risque et entraînez votre stratégie avec des fonds virtuels dès aujourd’hui.
Ouvrir un compte démo gratuitQuelle unité de temps est la meilleure pour les figures Shooting Star ?
Les Shooting Stars en journalier et en 4 heures atteignent une précision de 65-70 % ; les Shooting Stars en 1 heure affichent une précision de 58 % ; les Shooting Stars en 15 minutes n’affichent que 50 % de précision. Les unités de temps supérieures offrent une fiabilité supérieure car les traders institutionnels dominent les unités de temps plus longues.
Les traders professionnels concentrent les retournements sur Shooting Star sur les graphiques journaliers et 4 heures, évitant le bruit des unités de temps inférieures. Confirmer un Shooting Star journalier avec un alignement sur le graphique 4 heures (en vérifiant que le graphique 4 heures montre également une pression vendeuse) augmente la précision à plus de 75 %.
Points clés
- Les Shooting Stars sont des figures de retournement baissier caractérisées par de petits corps dans la partie basse de la plage de variation avec des mèches supérieures étendues dépassant 2-3 fois la hauteur du corps.
- Les Shooting Stars aux niveaux de résistance majeurs atteignent une précision de retournement de 65-70 % ; les figures en milieu de plage n’atteignent que 50 % et doivent être évitées.
- La confirmation par la bougie suivante clôturant plus bas est obligatoire ; les figures isolées sans confirmation échouent dans plus de 40 % des cas.
- Les Shooting Stars au corps rouge sont statistiquement plus forts que les verts, indiquant une domination des vendeurs tout au long de la séance.
- L’expansion du volume sur les Shooting Stars augmente la fiabilité de 30 % ; les figures à faible volume échouent souvent et piègent les vendeurs à découvert.
- Les unités de temps journalières et 4 heures offrent une précision de 65-70 % pour les Shooting Stars ; les unités de temps inférieures n’affichent que 50 % de succès en raison du bruit algorithmique.
Foire aux questions
Cet article contient des références aux figures Shooting Star, à l’analyse en chandeliers et à Volity, une plateforme de trading de CFD réglementée. Ce contenu est produit à des fins éducatives uniquement et ne constitue pas un conseil financier ou une recommandation d’achat ou de vente d’un instrument financier. Vérifiez toujours le statut réglementaire actuel et les détails de la plateforme avant d’utiliser un service de trading. Certains liens dans cet article peuvent être des liens d’affiliation.