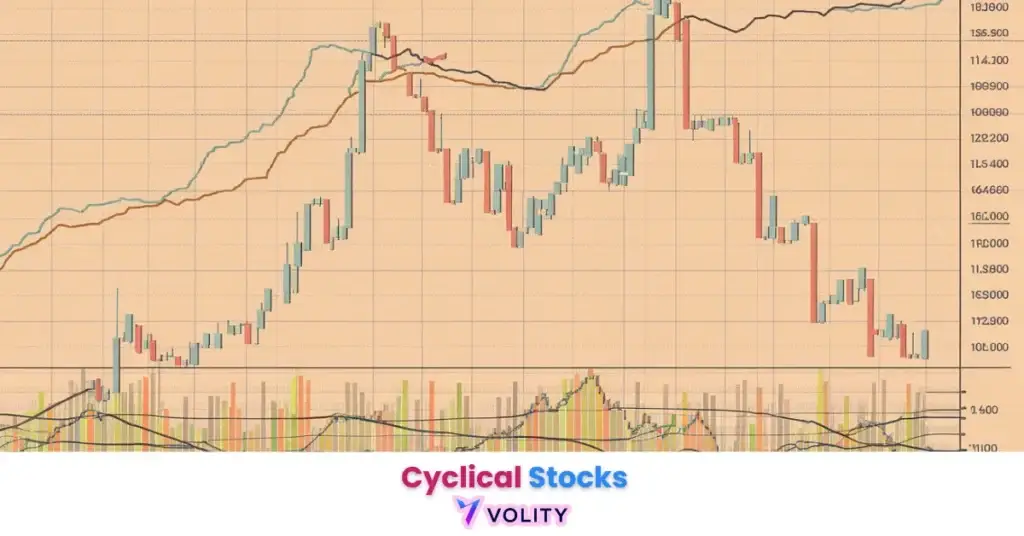
Cyclical stocks experience extreme price volatility during economic recessions where 20%+ declines in a single quarter are common, particularly for companies with high debt loads and capital-intensive operations. Earnings estimates for cyclical companies can collapse unexpectedly when economic forecasts downshift, triggering cascading analyst downgrades and forced margin call liquidations. The “Late-Cycle Trap” ensnares investors who buy cyclicals at peak valuations just as the economic expansion begins to slow, resulting in multiyear drawdowns regardless of dividend yields or technical support levels. Past performance is not indicative of future results. Capital at risk.
Cyclical stocks are the equity shares of companies whose performance is tightly linked to the broader economic cycle, thriving during expansion and struggling during recessions. These companies typically operate in sectors like industrials, financials, and energy, where demand fluctuates with consumer confidence and industrial output. The cyclicals category was popularised by Peter Lynch. In 2026, cyclical stocks are experiencing a resurgence driven by a faster-than-expected economic acceleration and massive investment in AI infrastructure, requiring traders to monitor employment data and interest rate shifts as primary catalysts.
Cyclical stocks function as the primary engine for capital appreciation during periods of sustained economic growth. These securities identify businesses that produce non-essential goods and services which consumers and corporations prioritize when confidence is high. They serve as a critical vehicle for “Risk-On” investment strategies in 2026, with Diversification Strategy balancing cyclical exposure against defensive positions to manage portfolio volatility.
The 2026 economic environment highlights the importance of sector timing over broad market exposure. Understanding the relationship between GDP growth and corporate profitability allows investors to transition from defensive “Safe Havens” to aggressive cyclical positions as the recovery phase accelerates.
While understanding Cyclical Stock is important, applying that knowledge is where the real growth happens. Create Your Free Forex Trading Account to practice with a free demo account and put your strategy to the test.
What is a cyclical stock and how does it work?
A cyclical stock is a financial security representing ownership in a company whose revenue and stock price are heavily influenced by the fluctuations of the broader business cycle. When the economy expands, discretionary spending increases and corporations invest heavily in capital equipment, driving strong earnings growth for cyclical companies. During contractions, consumers cut spending on non-essential goods and corporations delay infrastructure investments, collapsing cyclical earnings and stock prices simultaneously.
Cyclical stocks fundamentally depend on economic momentum rather than defensive cash flows. A luxury retailer’s sales plummet when unemployment rises, even though their stores remain open. An industrial equipment manufacturer’s bookings evaporate when factory utilization rates decline. These earnings fluctuations create extreme stock price volatility: a cyclical stock might trade at 8x earnings during a boom and 20x earnings during a bust, creating constant opportunities for mean-reversion trading.
The link between GDP growth and corporate profitability is direct and, in the cyclical sectors, amplified: earnings swing by a multiple of the change in output, because fixed costs do not fall when volumes do. That amplification is the whole reason cyclicals lead in a recovery and lag hardest in a contraction. Interest rates represent the transmission mechanism: lower rates reduce borrowing costs for capital-intensive cyclicals and increase consumer discretionary income for cyclical consumer companies.
Cyclical vs. Defensive Stocks
Defensive stocks provide stable returns by selling essential goods, whereas cyclical stocks offer higher growth potential through the sale of economically-sensitive products. Utilities, consumer staples (food, beverages), and healthcare represent defensive sectors because demand for electricity, groceries, and medicines remains stable regardless of economic conditions. Energy, industrials, materials, and consumer discretionary represent cyclical sectors because their demand fluctuates with economic momentum.
The “Odd Couple” phenomenon in 2026 breaks historical patterns: both cyclicals and defensive stocks are simultaneously outperforming technology despite traditional economic theory suggesting they move inversely. This occurs because the recovery is broad-based (benefiting cyclicals) while interest rate cuts reduce the duration risk that previously supported technology valuations. Understanding this nuance prevents investors from incorrectly assuming that cyclical strength signals an imminent market crash.
Ready to Elevate Your Trading?
You have the information. Now, get the platform. Join thousands of successful traders who use Volity for its powerful tools, fast execution, and dedicated support.
Create Your Account in Under 3 MinutesIdentifying the 5 Primary Cyclical Sectors in 2026
Market participants categorize cyclical stocks into five primary groups including energy, industrials, financials, materials, and consumer discretionary. Energy and materials depend on pricing cycles driven by supply constraints and macroeconomic demand. Crude oil rallies during GDP acceleration and crashes during recessions, with crude carrying a geopolitical risk premium on top of fundamental supply and demand whenever a supply route is in question. Copper, lithium, and rare earths follow similar patterns, with AI infrastructure demand creating structural deficits.
Industrials capture the business spending cycle: factory equipment, construction equipment, and heavy machinery spending surges when capital expenditure budgets expand. Data-centre and grid construction is driving a capital expenditure cycle that lands squarely in the industrial sector, which is why industrial order books have been the clearest read on that build-out. Financials (banks, insurance) benefit from higher interest rates that widen lending margins, but suffer during credit crunches when loan losses spike.
Consumer Discretionary captures the consumer spending cycle: automotive, luxury goods, restaurants, and entertainment thrive when consumer confidence is high and unemployment is low. The “K-Shaped” recovery in 2026 splits luxury consumers (spending aggressively on premium goods) from mid-market consumers (constrained by higher living costs). Understanding this split prevents investors from overgeneralizing the consumer discretionary sector. Stock Market Sectors sets out how the discretionary bucket splits, and why a single sector label can hide two opposite trends inside it.
How to time your entry into cyclical leaders
Sector rotation and macroeconomic lead indicators represent the most effective tools for timing entries into high-beta cyclical stocks. The ISM Manufacturing PMI (Purchasing Managers’ Index) functions as the primary lead indicator: when PMI crosses above 50, factory managers report expanding orders and optimism about the months ahead, signaling that cyclical earnings are about to accelerate. Employment data (Non-Farm Payroll, Unemployment Rate) confirms that the consumer has the income and confidence to sustain cyclical demand.
Yield Curve Analysis reveals the stance of monetary policy: a normalizing yield curve (where longer-duration bonds yield more than short-term bonds) signals that central banks expect sustained growth without inflation threats, supporting cyclical valuations. An inverted curve (where short-term yields exceed long-term yields) signals recession fears and represents a warning to exit cyclical positions.
Worked illustration of the rule, not a record of a specific trade: a heavy-equipment maker is added as the ISM Manufacturing PMI crosses back above 50, which is the point at which factory managers first report expanding orders. The position is taken on the data inflection rather than on the company narrative, and it is sized on the understanding that the same beta works in reverse if the PMI rolls over. Past performance is not indicative of future results. The real alpha came not from stock picking but from Economic Forecasts timing: entering cyclicals at the moment the data inflection occurred, before the broader market recognized the acceleration.
Performance Analysis: Cyclicals vs. Defensives in 2026
What separates cyclical from defensive equities is not the size of the return in any one year but where the return comes from. Energy and materials are priced off the commodity cycle and off supply disruption. Staples and utilities are priced off the discount rate and the reliability of the cash flow. Comparing them on a single performance number tells you almost nothing; comparing them on what would have to change for the return to reverse tells you most of what matters.
Long-duration growth names carry the opposite exposure: their valuation is a function of the discount rate, so the same earnings stream supports a lower multiple when rates rise and a higher one when they fall. That is the mechanical reason a rate move can rotate capital out of growth and into cyclicals without either set of earnings changing at all.
| Sector | Cyclical or defensive | Typical beta | What actually drives it |
| Energy | Cyclical | Above 1 | Commodity cycle and supply disruption |
| Materials | Cyclical | Above 1 | Industrial and construction demand |
| Consumer discretionary | Cyclical | Above 1 | Employment and consumer confidence |
| Financials | Cyclical | Above 1 | Lending margins and credit losses |
| Consumer staples | Defensive | Below 1 | Inelastic demand for essentials |
| Utilities | Defensive | Below 1 | Discount rate and regulated returns |
Classification follows the standard cyclical and defensive sector split, which rests on the business cycle described in the Wikipedia article of that name. No return figures are quoted, because sector performance changes daily and any number printed here would be stale.
The risks and limitations of cyclical investing
Extreme price volatility and high sensitivity to interest rate policy represent the primary risks for investors holding large cyclical positions. Cyclical earnings can decline 30-50% year-over-year during a recession, creating a “negative surprise” cascade where analysts cut targets repeatedly, triggering forced selling at lower and lower prices. The “Laggard” Trap ensnares investors who enter cyclicals just as the economic expansion peaks: missing the inflection point by even one quarter can mean the difference between 20% gains and 30% losses.
Debt dependency amplifies risk: cyclical companies often carry high leverage to fund their capital-intensive operations. When interest rates spike, debt service costs consume earnings, leaving nothing for shareholders. A cyclical company with 3x leverage that earns $10/share during expansion might only earn $2/share during contraction, not because revenues collapsed, but because interest expense doubled.
Market Volatility in cyclicals creates secondary risks through options strategies: selling cash-secured puts on cyclical companies during downturns can result in forced stock purchases at prices significantly higher than the ultimate bottom.
Turn Knowledge into Profit
You have done the reading, now it is time to act. The best way to learn is by doing. Open a free, no-risk demo account and practice your strategy with virtual funds today.
Open a Free Demo AccountIntegrating Cyclicals into a 2026 Portfolio
Portfolio rebalancing and the use of sector-specific ETFs represent the most efficient methods for managing cyclical exposure. The 20% Rule limits any single cyclical sector to 20% of total equity weight, preventing concentration risk from derailing a portfolio when a single sector experiences a downturn. Using Stock Screeners to filter for low-debt, high-growth cyclical names identifies quality cyclicals with sustainable competitive advantages rather than commodity-like businesses vulnerable to commoditization.
Fundamental Analysis of cyclical companies requires forward-looking earnings estimates and margin assumptions: a company trading at a cheap P/E ratio might still be expensive if consensus underestimates the earnings decline in the coming recession. Stress-testing valuations under different GDP growth scenarios identifies which cyclicals maintain acceptable returns even if the expansion stalls.
Key Takeaways
- [Cyclical stocks] are equities that follow the broader economic business cycle, performing best during expansion and growth phases.
- [Sector rotation] is the primary strategy for cyclical investors, moving capital into industries like energy and industrials as growth picks up.
- [Beta values] above 1.0 are common in cyclical stocks, indicating that they typically move more aggressively than the overall market index.
- [Macroeconomic indicators] such as ISM PMI and unemployment data are essential lead signals for timing cyclical market entries and exits.
- [Economic sensitivity] makes these stocks vulnerable to interest rate hikes, which can slow the borrowing and spending they depend on.
- [Diversification] between cyclical and defensive stocks is essential in 2026 to protect a portfolio from sudden shifts in economic momentum.
Frequently Asked Questions
This article contains references to cyclical stocks and Volity, a regulated CFD trading platform. This content is produced for educational purposes only and does not constitute financial advice or a recommendation to buy or sell any financial instrument. Always verify current regulatory status and platform details before using any trading service. Some links in this article may be affiliate links.