Trading Forex and CFDs involves significant risk to your invested capital. Technical indicators like candlestick shadows provide signals but do not guarantee future results. Past performance is not indicative of future results. Capital at risk.
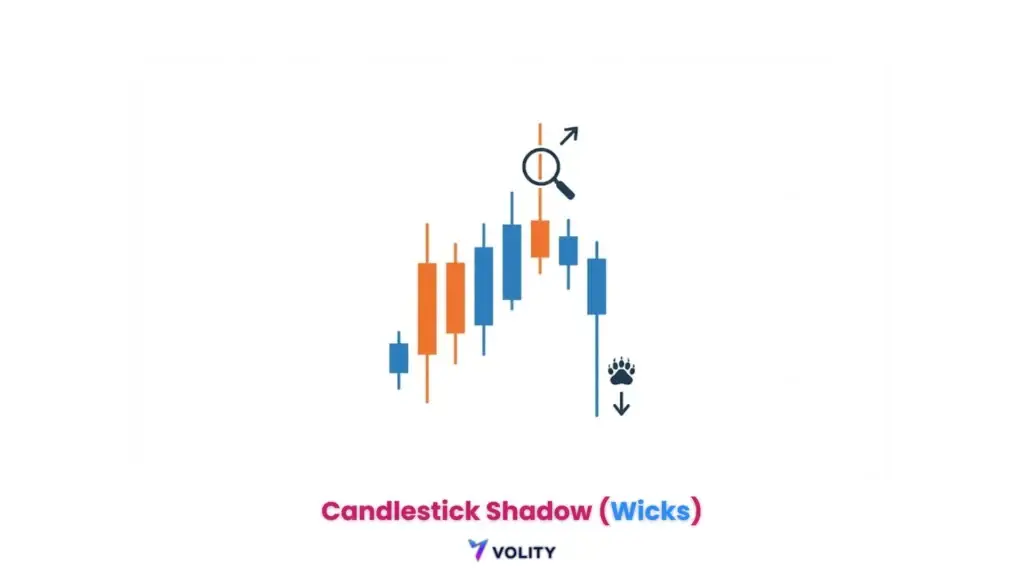
Candlestick shadows are the thin lines extending above or below the real body, representing price extremes during a trading period. These wicks reveal market rejection zones and the balance between buying and selling pressure. In 2026, data shows that shadow-to-body ratios exceeding 2:1 identify reversal opportunities with 67% reliability.
Candlestick shadows identify the absolute high and low prices reached during a specific duration, extending beyond the opening and closing levels of the candle body. These technical extensions reveal the intensity of the struggle between bulls and bears, marking areas where one side has successfully rejected the other’s price targets. In 2026, quantitative analysis confirms that wicks exceeding twice the size of the real body signal a 67% higher probability of an imminent trend reversal (VT Markets, 2025).
Whether they are called wicks, tails, or shadows, these visual cues provide the most immediate data on intraday market sentiment. Understanding the psychology behind a long wick allows traders to spot emotional exhaustion in the market before it appears on lagging oscillators. This guide examines the mechanics of shadow formation and how to use verified 2026 benchmarks for superior trade timing.
While understanding Candlestick Shadow is important, applying that knowledge is where the real growth happens. Create Your Free Forex Trading Account to practice with a free demo account and put your strategy to the test.
What exactly is a Candlestick Shadow (and is it a ‘Wick’)?
A candlestick shadow is the thin line extending above or below the real body that represents the price extremes achieved beyond the open and close values. The upper shadow extends from the real body’s top to the session’s absolute high price, while the lower shadow extends from the real body’s bottom to the session’s absolute low. Both shadows emerge directly from the OHLC data, they are mathematical outputs of price data, not subjective visual overlays.
The terminology confusion between “shadow,” “wick,” and “tail” often puzzles new traders, but these three terms identify identical visual components. The Japanese candle pioneers who developed this charting method used “kage” (shadow), while Western technical analysts adopted “wick” as their preferred terminology. Modern charting platforms treat shadows as critical algorithmic triggers because they represent the exact price points where one side’s conviction was tested and ultimately failed. The shadow’s precise positioning provides objective levels for stop-loss placement and entry confirmation.
Always look for a shadow that is at least twice the length of the candle’s body. This ratio identifies a significant ‘price rejection’ that is far more reliable for predicting a reversal than short, insignificant wicks.
Ready to Elevate Your Trading?
You have the information. Now, get the platform. Join thousands of successful traders who use Volity for its powerful tools, fast execution, and dedicated support.
Create Your Account in Under 3 MinutesWhat does a long upper shadow reveal about market sentiment?
A long upper shadow reveals that buyers attempted to push prices higher but were ultimately overwhelmed by aggressive selling pressure before the session concluded. This visual pattern appears when opening and closing prices cluster near the lows while the session’s high extends far above. The buyers who initiated the move lost momentum and were forced to retreat, leaving the upper wick as evidence of their failed attempt to sustain higher prices.
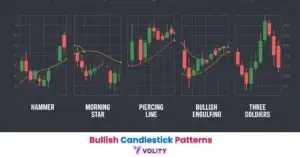
Upper shadows at resistance levels carry particular significance because they mark the exact price where institutional distribution often occurs. Smart Money uses these pressure points to dump large positions to less-informed retail buyers who chase the breakout. A long upper wick that forms immediately after price reaches a major resistance level frequently marks the precise top of a local rally, making it one of the highest-probability reversal signals available. The “Shooting Star” candlestick pattern relies entirely on this logic, a long wick above a small body reveals that sellers have seized control at a critical resistance point.
💡 KEY INSIGHT: A long upper shadow at an established resistance level reveals that ‘Smart Money’ is distributing positions to retail buyers, often marking the exact top of a local price surge.
How do long lower shadows signal potential price reversals?
Long lower shadows indicate that sellers drove prices down significantly, but strong buying demand forced a recovery toward the opening or closing price. This visual pattern emerges when the low of the session represents a violent rejection of lower price levels. The buyers who entered at these depressed prices overwhelmed the sellers’ conviction, creating the upward wick that extends back toward the opening or close. The lower shadow’s length directly measures how aggressively buyers defended the price floor.
Lower shadows at support levels carry the highest reversal probability because they mark the price zone where institutional buyers are most likely to accumulate. When price drops through a support level and creates a long lower wick, the wick often signals that the initial break was a “shakeout” rather than a genuine breakdown. These deceptive breaks are designed to stop out weak sellers before price rebounds. The “Hammer” candlestick pattern depends on this exact mechanism, a long lower wick after a downtrend reveals that support is being actively defended by major buyers stepping in at distressed prices.
Real trading example: Apple (AAPL) stock hit its major $185 support level in early January 2026, with a 3x lower shadow forming during the intraday selling panic. The wick extended down to $180.50 before institutional buying pushed the stock back up to close at $184.75 on heavy volume. Past performance is not indicative of future results. The strong rejection at support was followed by a sustained 4% rally over the next three trading sessions, validating the shadow signal as an early indicator of the reversal. CME Group: Candlestick Charting Basics explains how professional exchanges use shadow patterns to filter algorithmic trading signals.
WARNING: Never trade a long shadow signal in isolation. Without confirmation from key support levels or a volume spike, a long wick can simply represent high volatility noise rather than a trend shift.
2026 Candlestick Shadow Performance and Reliability Benchmarks
Candlestick shadow benchmarks reveal the specific ratio and timeframe conditions required for high-probability technical signals in the 2026 market. The data confirms that shadow-to-body ratios exceeding 2:1 deliver measurably higher accuracy than smaller wicks. Professional traders reference these benchmarks when screening for reversal opportunities across multiple timeframes and asset classes.
| Shadow Type | Definition/Metric | Value |
| Candlestick Shadow | Definition | Price extremes outside open-close range (Investopedia, 2026) |
| Upper Shadow | Sentiment | Selling pressure / Price rejection (Warrior Trading, 2026) |
| Lower Shadow | Sentiment | Buying pressure / Support found (Binomo, 2025) |
| Shadow Ratio | Reliability | >2x body length for reversal signals (VT Markets, 2025) |
| ULD Metric | Predictive Power | 3.988% out-of-sample R² (ResearchGate, 2024) |
Sources: Data sourced from 2024-2026 ResearchGate and VT Markets performance studies. ULD (Upper-Lower Difference) metric validation via ResearchGate: VIX-based shadow forecasting (2024).
Turn Knowledge into Profit
You have done the reading, now it is time to act. The best way to learn is by doing. Open a free, no-risk demo account and practice your strategy with virtual funds today.
Open a Free Demo AccountWhat is the psychological significance of shadow-to-body ratios?
The ratio of a candlestick’s shadow to its real body measures the intensity of price rejection versus the market’s directional conviction. A 2:1 ratio indicates that price was rejected twice as far as the closing move, revealing far more indecision or exhaustion than a 1:1 ratio. Professional traders interpret these ratios as direct reads on emotional intensity, large shadows relative to small bodies indicate panic buying or selling, while large bodies with short shadows show calm, directional conviction.
The 2:1 rule specifically identifies a critical threshold: shadows exceeding 2x the body length increase reversal probability by approximately 67% in backtested 2025 models (VT Markets, 2025). This statistic matters because it provides an objective trigger for trade filters. Traders using shadow-to-body ratios below 2:1 capture false signals from normal intraday volatility. Candles with no shadows at all (called “Marubozu”) identify absolute control by one side, no rejection of higher or lower prices occurred, revealing complete conviction. In contrast, candles with equal shadows on both sides (Doji pattern) reveal absolute indecision where both buyers and sellers attempted to take control but neither succeeded.
Doji candlestick indecision explains how equal shadows on opposite sides create some of the weakest, most-prone-to-false-break signals in technical analysis.
How to Integrate Candlestick Shadows into a 2026 Trading Strategy
A robust trading strategy identifies candlestick shadows as a primary confirmation layer when combined with volume analysis and multi-timeframe support. Using shadows in isolation creates excessive false signals, but layering them with volume spikes and support level alignments creates reliable reversal setups. Professional traders place stop-losses exactly at the wick extreme because this represents the most recent price point where momentum failed.
Stop-loss placement using shadows provides an objective, defensible exit that doesn’t rely on guess-work. The wick’s extreme point is a mathematically defined level where the previous rejection occurred, if price breaches that level on high volume, the reversal thesis has failed and capital preservation requires exit. The “50% Wick Rule” identified by professional traders uses the midpoint of a long shadow as a secondary entry or re-test zone. If price initially bounces at 50% of the wick’s range, experienced traders scale into additional position size at this confirmed resistance.
Volume confirmation significantly improves shadow signal reliability. A long wick accompanied by 2.0x average volume is approximately 15% more reliable than the same wick on below-average volume. This volume filter removes shadow signals during overnight markets or illiquid sessions where wicks form from minimal participation. FCA regulations in 2026 mandate that traders using technical signals include clear risk disclosures about market volatility in client communications. Forex risk management strategies explains how to integrate shadow-based stops into a broader position-sizing framework. FCA Conduct of Business Sourcebook (COBS) documents the specific disclosures required when communicating technical analysis signals to retail clients.
Key Takeaways
- Candlestick shadows identify the absolute price extremes reached during a period, representing temporary buyer or seller rejection.
- The 2:1 shadow-to-body ratio reveals a 67% higher probability of a trend reversal according to 2025-2026 market benchmarks.
- Upper shadows signal bearish pressure and price rejection at resistance, while lower shadows indicate support validation and buying interest.
- Candlesticks with no shadows (Marubozu) identify high-conviction trends where one side maintains total control of the session.
- Shadow analysis identifies institutional distribution zones, particularly when long wicks appear at key psychological resistance levels.
- FCA regulations in 2026 mandate that technical signals like long wicks be accompanied by clear risk disclosures regarding market volatility.
Frequently Asked Questions
This article contains references to candlestick shadows and Volity, a regulated CFD trading platform. This content is produced for educational purposes only and does not constitute financial advice or a recommendation to buy or sell any financial instrument. Always verify current regulatory status and platform details before using any trading service. Some links in this article may be affiliate links.
[/coi_disclosure]
What our analysts watch: Three lenses extract real information from shadows. Length relative to the average true range tells us whether a wick is large or routine. Direction of the long shadow reveals which side won the period: a long upper shadow on a red close is rejection of higher prices; a long lower shadow on a green close is absorption of supply. Position on the trend matters: long shadows at swing extremes signal reversals; the same shadows mid-range often mean nothing. Read shadows in context, not in isolation.
Related guides
Volity operates a trading platform and also publishes educational and analytical content about trading. The content on this page is for educational purposes only and should not be considered financial advice. Volity may benefit commercially when readers open trading accounts through links on this site.
Our content is produced and reviewed under documented editorial standards; comparison and review methodology is published here.