Technical analysis on trending markets risks “pegging” at extremes, causing false reversal signals that trap retail stops. Fundamental analysis lags price, particularly during sentiment-driven rallies divorced from intrinsic value. Investors like Bill Ackman pair fundamental conviction with a willingness to act against the crowd. Narrative-driven volatility in 2026 decouples fundamental value from price for extended periods; waiting for perfect alignment between both methods causes analysis paralysis and missed moves. Combining both approaches reduces risk but does not eliminate it. Past performance is not indicative of future results. Capital at risk.
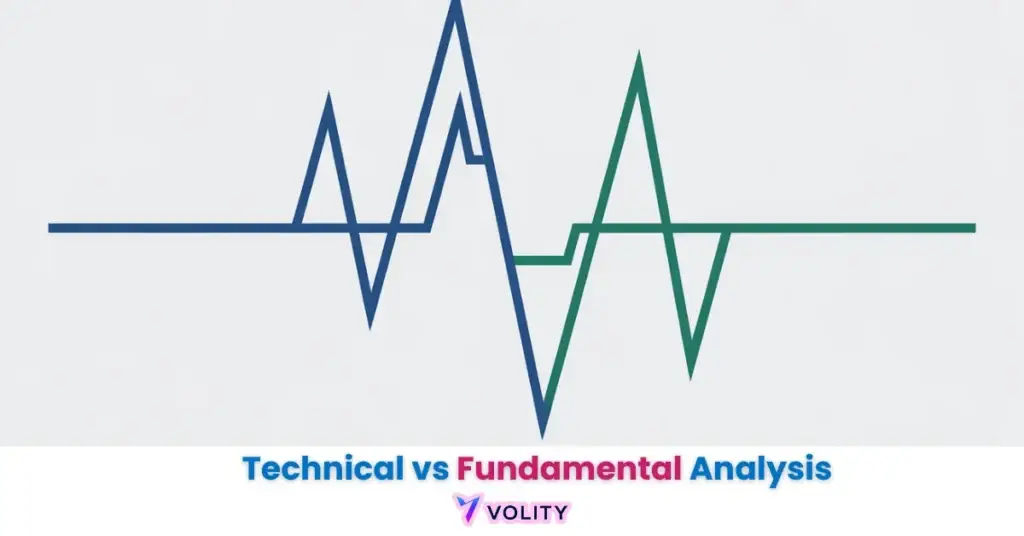
Technical vs fundamental analysis represents the two primary methodologies for evaluating financial markets. Fundamental analysis focuses on “why” an asset has value based on economic and financial health, while technical analysis focuses on “what” the price is doing via charts. In 2026, the professional benchmark is the “Techno-Funda” hybrid model, which uses macro-data to identify directional bias and technical indicators for execution precision.
Technical vs fundamental analysis serves as the dual-lens framework for interpreting modern financial markets. While technical analysis focuses on price action and volume patterns to predict short-term moves, fundamental analysis evaluates the intrinsic value of an asset through economic and financial data. The 2026 investment landscape demands a mastery of both to survive high-frequency algorithmic environments.
The debate between these two schools of thought has evolved from a mutual exclusivity to an integrated “Techno-Funda” consensus. Professional traders now leverage fundamental data to determine the “What” and technical indicators to solve the “When.”
While understanding Technical vs Fundamental Analysis is important, applying that knowledge is where the real growth happens. Create Your Free Forex Trading Account to practice with a free demo account and put your strategy to the test.
What is the main difference between technical and fundamental analysis?
The primary distinction between technical and fundamental analysis is the focus on price action versus intrinsic value as the driver of investment decisions. Technical analysis examines historical price patterns, volume, and momentum indicators to forecast short-term price movements. Fundamental analysis evaluates earnings reports, economic data, and competitive advantages to determine an asset’s true value independent of current market price.
- Technical analysis: Focus on “What” (Price, Volume, Charts)
- Fundamental analysis: Focus on “Why” (Earnings, Macroeconomics, Policy)
- Time horizons: Short-term trading vs. long-term value allocation
Institutional flow dominates turnover in most listed markets, and it is driven primarily by fundamental and macro views rather than by chart shapes. That is why retail traders who ignore fundamental context are exposed to sudden directional reversals when institutions reposition.
The Core Philosophy of Market Efficiency
Market efficiency indicates that all known fundamental information is reflected in price, though technical analysis identifies the behavioral lag in that adjustment. The Efficient Market Hypothesis (EMH) posits that all available information is instantly priced in, making prediction impossible, yet behavioural finance finds that investors consistently misprice assets during early news cycles. In 2026, AI sentiment filters accelerate the pricing of fundamental news, compressing the window where technical traders can exploit behavioral delays.
Ready to Elevate Your Trading?
You have the information. Now, get the platform. Join thousands of successful traders who use Volity for its powerful tools, fast execution, and dedicated support.
Create Your Account in Under 3 MinutesDeep Dive: The Tools of Fundamental Analysis in 2026
Fundamental analysis tools are the qualitative and quantitative metrics used to determine the financial health and future earnings potential of an asset. These metrics provide the baseline thesis that separates high-quality assets from deteriorating ones, allowing traders to build a defensible portfolio even during volatile price swings.
Macroeconomic factors drive directional bias for entire asset classes. Central bank policy decisions, such as interest rate changes or quantitative easing announcements, shift trillions in capital allocation within minutes. Inflation data (CPI) determines bond yields, currency valuations, and equity multiples. GDP growth rates signal economic health and corporate earnings potential across all sectors.
Financial statement analysis examines income statements to evaluate profitability trends, balance sheets to assess leverage and liquidity, and cash flow statements to verify whether earnings are genuine or artificially inflated. Valuation ratios like the P/E ratio (Price-to-Earnings) measure whether an asset is expensive relative to historical norms, while the Price-to-Book ratio identifies whether book value provides a safety floor for investors.
In 2026, “AI-Forward” earnings multipliers have emerged as a critical tool. These models adjust traditional P/E ratios upward for companies with high exposure to artificial intelligence revenue streams, reflecting institutional belief that AI adoption will accelerate future earnings beyond historical growth rates.
Use fundamental analysis to build a “Safe List” of high-quality assets, then wait for technical triggers like a 200-day EMA bounce or RSI divergence to execute the trade; this prevents “buying the dip” on companies with deteriorating balance sheets.
Deep Dive: The Tools of Technical Analysis in 2026
Technical analysis tools are the mathematical indicators and chart patterns used to identify market momentum and institutional entry points. These tools extract timing signals from price history, allowing traders to execute entries when the probability of success is highest, a critical edge when competing against algorithmic systems.
Price charts remain the foundation of technical analysis despite advances in AI. Candlestick patterns show the battle between buyers and sellers across discrete time periods, revealing institutional order flow clustering and retail stop-loss vulnerability. Renko charts filter out noise by showing only significant price moves, while 2026 traders increasingly prefer “Messy Patterns”, complex, irregular formations that resist institutional prediction models and therefore attract genuine institutional buying when they resolve.
Technical indicators mathematize price behavior into signals. The 200-day EMA serves as the “Institutional North Star”, major banks have algorithmic buy orders resting at this dynamic support level, creating a self-fulfilling prophecy where price repeatedly bounces off it. RSI divergence (price makes a new low while RSI makes a higher low) identifies momentum exhaustion and often precedes reversals. VWAP (Volume-Weighted Average Price) identifies the “fair value” weighted by institutional order sizes, marking zones where big traders cluster their positions.
Market structure analysis identifies “Liquidity Zones” and Fair Value Gaps (FVG). Liquidity Zones are price areas where retail stop-losses cluster; institutional algorithms intentionally push price through these zones to trigger retail exits before reversing in the original direction. Fair Value Gaps are price voids between candles, areas where no trading occurred, that act as magnets for price return because they represent unfilled institutional orders.
The 2026 “Techno-Funda” Hybrid Strategy: Efficacy and Workflow
Hybrid analysis identifies the ‘Techno-Funda’ workflow where fundamentals set the directional bias and technicals time the execution. This approach combines the directional robustness of fundamental analysis with the timing precision of technical indicators, dramatically improving win rates and risk-adjusted returns.
Step 1 involves fundamental screening to build the “Safe List.” A trader identifies assets meeting specific quality thresholds: positive earnings growth, rising cash flow, manageable debt levels, and competitive advantages. This filtering process eliminates consideration of fundamentally deteriorating assets, reducing the risk of “catching a falling knife” where technical signals suggest a bottom that is actually just the beginning of a longer decline.
Step 2 applies technical timing once the Safe List is established. Rather than chasing price action into fundamental weakness, traders wait for specific technical triggers: a 200-day EMA bounce, an RSI divergence recovery in oversold territory, or a Liquidity Sweep confirmation where algorithmic order flow signals institutional defense. This two-stage process delays entry by weeks or months but dramatically improves odds when both signals finally align.
Step 3 applies risk management using ATR-based stops (Average True Range, measuring volatility-adjusted position sizing) to survive narrative volatility. Because fundamental value can decouple from price for extended periods during market dislocations, ATR-stops allow traders to exit before fundamental value “catches down” to price, capturing gains while managing drawdowns.
A worked illustration of the sequence: sustained central-bank buying gives gold a fundamental bid, which sets the direction. The trader does not buy the headline. They wait for price to sweep a prior daily low, take out the stops resting under it, and then shift structure on the four-hour chart before entering in the direction the fundamentals already argued for. This is an illustration of the workflow, not a record of a trade. Past performance is not indicative of future results.
WARNING: Narrative-driven volatility in 2026 often causes fundamental value to decouple from price for extended periods; “analysis paralysis” occurs when traders wait for perfect alignment between both lenses, often missing the largest part of the move.
Comparative Efficacy of Analysis Methods (EAV Table)
Comparative data on analytical efficacy identifies the historical success rates of technical, fundamental, and hybrid approaches across market cycles.
| Analysis Type | What it is good at | Where it fails | Typical user |
| Pure technical | Timing entries and exits inside an established move | Blind to a macro regime change that invalidates the chart | Short-term traders |
| Pure fundamental | Deciding what is worth owning and at roughly what price | Says nothing about when, and value can stay ignored for years | Value funds |
| Hybrid (Techno-Funda) | Separating the what from the when | Waiting for both to agree can mean waiting a long time | Multi-strategy desks |
| Sentiment-only | Spotting crowding and positioning extremes | Reverses without warning and leaves no valuation floor | Momentum traders |
| Systematic / algorithmic | Executing a defined rule without hesitation | Only as good as the rule, and it degrades as conditions shift | Quant desks |
Framework definitions follow CFA Institute teaching on valuation and market analysis. No win-rate figures are quoted, because no published study measures “win rate” across these approaches in a way that would transfer to an individual account.
The case for combining the two lenses is structural rather than statistical: each covers the other’s blind spot. Pure technical strategies struggle during macro regime shifts because chart patterns assume historical relationships continue, but a central bank policy change invalidates years of accumulated price history overnight. Pure fundamental strategies miss short-term liquidity flows that push price far below intrinsic value temporarily, causing investors to exit positions prematurely.
💡 KEY INSIGHT: The practical division of labour is that the fundamental view decides direction and size, and the technical view decides the entry, the stop and the exit. Neither one is allowed to overrule the other’s job.
Which is better for Forex, Crypto, and Stocks?
Asset-specific characteristics determine the optimal weighting of technical and fundamental analysis for different financial instruments. Each asset class responds differently to macro cycles and institutional behavior patterns, requiring traders to adjust their Techno-Funda ratio accordingly.
Forex leans fundamental for direction (interest rates, central bank policy, trade balances) and technical for execution (structure, liquidity patterns). Interest rate differentials between two currencies drive long-term trends: USD/JPY rallies when the Fed raises rates while BOJ holds steady, creating a persistent carry trade that technical pullbacks fail to reverse. However, central bank intervention and technical structure breakouts can override fundamental interest-rate bias for months, making technical discipline essential for entry timing.
Crypto relies heavily on “On-Chain” fundamentals (blockchain transaction volume, developer activity, institutional capital inflows) combined with technical liquidity flows (order book depth, whale wallet movements). Pure fundamental analysis of cryptocurrencies is immature relative to traditional equities, making technical liquidity signals critical for avoiding “bag-holding” scenarios where fundamental narratives decay faster than price adjusts.
Stocks require high fundamental focus for selection, identifying profitable companies with competitive advantages, combined with technical precision for entry timing. A fundamentally excellent company can lose 40% in a poor macro environment; waiting for technical confirmation of a bottom (200-day EMA hold + RSI divergence recovery) often separates winners from average fundamental stock picks.
Turn Knowledge into Profit
You have done the reading, now it is time to act. The best way to learn is by doing. Open a free, no-risk demo account and practice your strategy with virtual funds today.
Open a Free Demo AccountKey Takeaways
- Technical vs fundamental analysis are the two core frameworks used to evaluate and predict price movements in financial markets.
- Fundamental analysis provides the “What” by determining an asset’s intrinsic value through earnings, economic data, and central bank policy.
- Technical analysis provides the “When” by identifying entry and exit points through price charts, volume, and momentum indicators.
- Combining the two frameworks is the professional default because each covers the other’s blind spot, not because any published study measures it as a win rate.
- Institutional flow dominates turnover, which makes the fundamental bias behind it a critical factor for retail technical traders to track.
- AI-driven narratives in 2026 have increased the frequency of technical “fake-outs,” requiring traders to use fundamental context to filter out noise.
Frequently Asked Questions
This article contains references to Technical vs. Fundamental Analysis, Trading Strategies, and Volity, a regulated CFD trading platform. This content is produced for educational purposes only and does not constitute financial advice or a recommendation to buy or sell any financial instrument. Always verify current regulatory status and platform details before using any trading service. Some links in this article may be affiliate links.