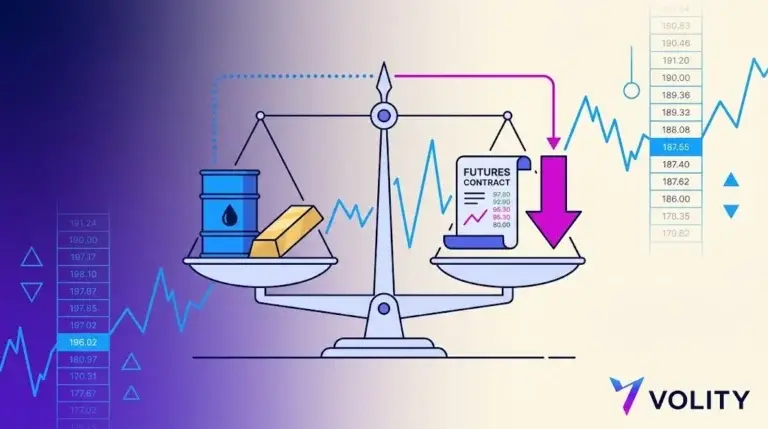
Gold futures contracts involve leveraged trading of standardized precious metals agreements on regulated exchanges. These instruments amplify both gains and losses, and participants face margin calls, forced position liquidation, and the risk of losing capital exceeding their initial deposit. The “paper-to-gold” ratio at 100:1 in 2026 indicates significant counterparty risk if physical delivery events occur. Past performance is not indicative of future results. Capital at risk.
A gold futures contract is a standardized legal agreement to buy or sell 100 troy ounces of gold at a specified price on a future date. In 2026, these instruments facilitate $450 billion in daily price discovery on the CME COMEX exchange. Utilizing inherent leverage, these contracts allow participants to manage price risk and speculate on 2026’s high-volatility regimes without the costs of physical storage.
Gold futures contracts function as the primary vehicle for institutional price discovery and capital-efficient hedging in the precious metals sector. These agreements identify the future value of gold by aggregating the expectations of commercial hedgers and large-scale speculators across global electronic exchanges. They represent a foundational component of the “paper gold” market, which currently trades over 100 times the volume of physical bullion.
The 2026 market landscape is defined by a shift toward percentage-based collateralization and a persistent geopolitical premium driven by Middle Eastern instability. Traders utilize these architectural changes to optimize their Leverage in Gold Trading and to navigate the “C-wave” correction that has characterized the second quarter of the year.
While understanding Gold Futures Contract is important, applying that knowledge is where the real growth happens. Create Your Free Crypto Trading Account to practice with a free demo account and put your strategy to the test.
What is a gold futures contract and how does its 2026 margin system function?
A gold futures contract is a legally binding agreement traded on a regulated exchange to exchange a standardized quantity of gold for a fixed price at a future date. The CME COMEX exchange operates as the central counterparty for all GC and MGC trades, with the clearing house ensuring zero counterparty risk for 560 million market participants. On January 13, 2026, the CME transitioned to a percentage-based margin system, requiring a 6.0% collateral deposit on all positions, a significant shift from the prior fixed-dollar methodology.
The current margin for a $477,000 notional gold contract is approximately $28,620 at the 6.0% standard rate (CME Group, May 2026). This percentage-based approach automatically scales collateral requirements as gold prices move, ensuring that Commodity Futures maintain consistent protection against volatility. Under this system, initial margin and maintenance margin both track the underlying contract value rather than remaining static through a trading cycle.
Standard (GC) vs. Micro (MGC) Specifications
Contract specifications are the standardized rules that define the quantity, tick size, and delivery terms for every gold futures trade. The standard GC contract represents 100 troy ounces of gold, with each tick worth $10.00, making it the dominant institutional instrument for price discovery. The Micro Gold Futures (MGC) contract offers 10 troy ounces per unit at $1.00 per tick, providing retail traders with the same leverage efficiency as GC but with significantly lower absolute capital requirements.
Ready to Elevate Your Trading?
You have the information. Now, get the platform. Join thousands of successful traders who use Volity for its powerful tools, fast execution, and dedicated support.
Create Your Account in Under 3 MinutesWhy did gold enter a “C-Wave” correction in Q2 2026?
The 2026 gold correction is a technical consolidation phase following the historic $5,602 peak driven by US sovereign debt reaching $38 trillion. From the January 2026 all-time high, gold pulled back 16% to the May $4,700 support zone as market participants reassessed the sustainability of the extreme valuation premium. The shift in Federal Reserve easing expectations, triggered by higher-than-expected CPI readings, removed a key tailwind that had propelled gold higher in late 2025.
The geopolitical “war premium” embedded in gold futures pricing reflects ongoing US-Iran negotiations and disruption risks in critical trade routes. Central banks, particularly those in China and India, maintained strong accumulation throughout the correction, signaling that institutional demand remains robust despite technical weakness. US sovereign debt reached $38 trillion in Q1 2026, serving as a long-term structural tailwind for gold prices (J.P. Morgan, 2026). Traders managing Central Bank Policy exposure increasingly view the May correction as a tactical re-entry opportunity rather than a bearish reversal.
Is the gold futures market in backwardation or contango?
Contango is the normal market condition where gold futures trade at a premium to the spot price to reflect the cost of carry. The cost of carry includes storage fees, insurance premiums, and the opportunity cost of capital (proxied by the 2026 Fed Funds rate). In contango markets, traders who hold futures contracts benefit from “roll yield”, a return generated simply by moving from near-term contracts toward distant expiration dates as the curve normalizes.
Backwardation, a rare condition where futures trade below spot, signals severe physical shortages or emergency demand for immediate delivery. Backwardation events are typically short-lived and create opportunities for cash-and-carry arbitrage strategies. As of May 2026, the gold futures market shows healthy bullish contango: June 2026 contracts ($4,730) trade at a $30 premium to the spot price ($4,700), indicating normal institutional participation and confidence in the forward curve’s sustainability.
Real trading example: An investor entered a long position in August 2026 Gold Futures (GCQ26) at $4,725 in May 2026 while spot gold traded at $4,697. The position captured the $28 “roll yield” as the curve normalized toward the $5,134 year-end forecast. Past performance is not indicative of future results. This trade demonstrates how contango environments reward patient positioning in longer-dated contracts, particularly when technical corrections create temporary disconnects between front-month and back-month pricing.
What are the primary risks of high “Paper-to-Gold” ratios?
The paper-to-gold ratio identifies the quantitative disconnect between total futures open interest and the physical bullion available for delivery. The table below compares key metrics from 2024 to May 2026, illustrating the structural leverage embedded in the current market:
| Metric | 2024 Value | 2026 Value | Source |
| Spot Gold Price | ~$2,350 | ~$4,700 | Investing.com |
| Paper-to-Gold Ratio | 65:1 | 100:1 | National Gold Group |
| COMEX Margin Rule | Fixed ($) | Percentage (%) | CME Group |
| US Sovereign Debt | $34 Trillion | $38 Trillion | U.S. Treasury |
| Gold ATH (Yearly) | $2,450 | $5,602 | Bloomberg |
Sources: Investing.com, National Gold Group, CME Group, U.S. Treasury, Bloomberg
The 100:1 ratio reflects a market where 100 units of financial claims exist for every 1 unit of physical gold held in COMEX-approved warehouses. This represents a 54% increase from the 65:1 ratio in 2024, highlighting the acceleration of paper-based speculation. At this leverage level, any disruption to the physical supply chain, whether from geopolitical events, warehouse defaults, or regulatory intervention, could trigger a “delivery squeeze” that widens the basis between futures and spot prices dramatically.
Gold Futures vs. Physical Gold: Which is better for 2026?
Physical gold is a non-custodial wealth preservation asset, whereas gold futures are capital-efficient tactical tools for price speculation. Physical bullion stored in your possession or in segregated vaults carries zero counterparty risk, you own the metal outright with no exchange dependency. Gold futures, by contrast, depend on the solvency of the CME, the clearing house, and your broker, creating a 100:1 leverage point relative to physical supply.
The “Fundamental Gap” refers to the premium that physical dealers charge above the COMEX spot price, particularly during periods of extreme demand. During the 2026 “January Surge,” some physical dealers reported premiums 15% above the official spot price; paper futures do not guarantee immediate physical delivery and cannot capture these local supply shocks. Retail traders utilizing the “Liquidity Regime” of high open interest in near-month contracts can move in and out of positions rapidly, but this advantage disappears during market dislocations when bid-ask spreads widen and liquidity evaporates.
Institutional portfolios are increasingly using a 70/30 split between physical bullion and tactical futures to balance safety with capital efficiency (Institutional Research, 2026). The physical component provides the non-correlated wealth preservation anchor, while futures positions allow participation in shorter-term technical trends and leverage-enhanced returns. For 2026, the choice between futures and physical depends entirely on your risk tolerance, time horizon, and capital requirements. Pure speculators with active management capacity benefit from futures; long-term wealth preservationists should prioritize physical Gold vs S&P 500 positions in their overall portfolio allocation.
Turn Knowledge into Profit
You have done the reading, now it is time to act. The best way to learn is by doing. Open a free, no-risk demo account and practice your strategy with virtual funds today.
Open a Free Demo AccountThe Role of the COT Report in 2026 Forecasting
The Commitment of Traders (COT) report represents the definitive map of institutional and commercial positioning in the gold futures market. The CFTC publishes detailed positioning data every Friday, breaking down the net long or short exposure held by three categories: commercial hedgers (primarily producers and jewelry makers), non-commercial speculators (hedge funds and CTAs), and retail traders. By monitoring shifts in these positions week-over-week, traders identify whether large players are accumulating or liquidating exposure ahead of fundamental events.
In Q2 2026, commercial hedgers, representing the actual mining and consumption side of the industry, maintained record net short positions (hedging production against lower future prices). Non-commercial speculators, conversely, were net long, indicating that large funds were betting on higher prices despite the technical correction. This divergence signals that institutional sentiment remains bullish even as price action consolidates. The Commitment of Traders (COT) data confirms that central bank accumulation forecasts of 800 tonnes by year-end are being actioned by real buyers, not just reflected in speculative positioning.
Speculation in Trading through large futures positions can amplify price swings, but the COT structure ensures transparency about who holds what exposure. When non-commercial net longs exceed historical averages, markets become vulnerable to “whipsaw” reversals if sentiment shifts. The 2026 COT landscape shows a constructive bias from actual commercial users, supporting the bullish medium-term outlook even if short-term consolidation persists.
Key Takeaways
- Gold futures contracts are standardized 100-ounce agreements that facilitate institutional price discovery on the CME COMEX exchange.
- The percentage-based margin system, launched in January 2026, currently requires a 6.0% collateral deposit to maintain a gold position.
- The paper-to-gold ratio has expanded to 100:1 in 2026, highlighting a significant divergence between financial claims and physical bullion.
- Bullish contango remains the dominant market structure in 2026, with futures prices trading above spot to account for high storage and carry costs.
- The January 2026 ATH of $5,602 was driven by a record $38 trillion in US sovereign debt, serving as a permanent benchmark for current valuation.
- Micro Gold Futures (MGC) provide a 10-ounce alternative for retail traders seeking the same leverage benefits with reduced capital requirements.
Frequently Asked Questions
This article contains references to gold futures contracts and Volity, a regulated CFD trading platform. This content is produced for educational purposes only and does not constitute financial advice or a recommendation to buy or sell any financial instrument. Always verify current regulatory status and platform details before using any trading service. Some links in this article may be affiliate links.
Want the basics first? Read our trading gold guide.