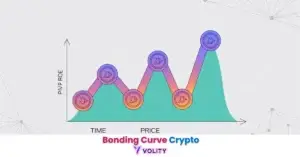
Ever stared at a crypto chart, noticed those vertical bars at the bottom, and wondered if they were just decoration? You see the price of Bitcoin or Ethereum moving, but what does that second graph—the trading volume—actually tell you? For many beginner and intermediate traders, understanding what volume is in crypto is the missing piece of the puzzle that separates guessing from strategic decision-making.
Volume isn’t just background noise; it’s the engine behind the price action. It measures the conviction, interest, and overall energy in the market. A price move without volume is a whisper; a price move with volume is a roar. By the end of this guide, you won’t just know the definition of trading volume—you’ll know how to read it, use it to confirm trends, spot reversals, and avoid common traps like wash trading.
While understanding Crypto Trading Volume is important, applying that knowledge is where the real growth happens. Create Your Free Forex Trading Account to practice with a free demo account and put your strategy to the test.
What Is Trading Volume, Exactly? (And Why It Matters)
In the simplest terms, trading volume is the total amount of a specific cryptocurrency that was traded during a given period. It’s typically measured in either the asset itself (e.g., 500,000 ETH) or its dollar equivalent (e.g., $1.5 billion of ETH). Think of it as a measure of market activity or “interest.”
If a price chart tells you what is happening, the volume chart tells you how much conviction is behind that movement. High volume indicates that many traders are participating, suggesting a strong consensus behind the price action. Low volume, on the other hand, signals weak participation and a lack of conviction, making the price move less reliable.
How Is Crypto Volume Calculated?
The calculation is straightforward: volume is the sum of all trades that occurred within a specific timeframe (like 24 hours, one hour, or five minutes).
For example, if within 24 hours on a single exchange:
- Trader A buys 1 BTC from Trader B.
- Trader C buys 2 BTC from Trader D.
- Trader E sells 0.5 BTC to Trader F.
The total 24-hour volume for Bitcoin on that exchange would be 1 + 2 + 0.5 = 3.5 BTC. Exchanges then aggregate this data across all trading pairs (like BTC/USD, BTC/EUR) to report a total 24-hour volume, often expressed in USD. If Bitcoin has a 24-hour volume of $20 billion, it means $20 billion worth of Bitcoin changed hands across all major exchanges in that period.
The 3 Key Things Volume Tells You
At its core, volume analysis helps you gauge the health and strength of price movements. It provides critical context that price alone cannot offer.
- Trend Strength & Confirmation: High volume during an uptrend confirms strong buying pressure and bullish conviction, which ultimately drives changes in market cap. Understanding this link helps traders connect liquidity with market value movements. High volume during a downtrend confirms strong selling pressure and bearish conviction. A trend accompanied by declining volume is often a warning sign that the trend is losing momentum.
- Market Interest & Liquidity: Assets with consistently high trading volume are considered highly liquid. This means you can buy or sell large amounts without significantly impacting the price, resulting in lower slippage and tighter bid-ask spreads. Low-volume assets are illiquid and riskier to trade.
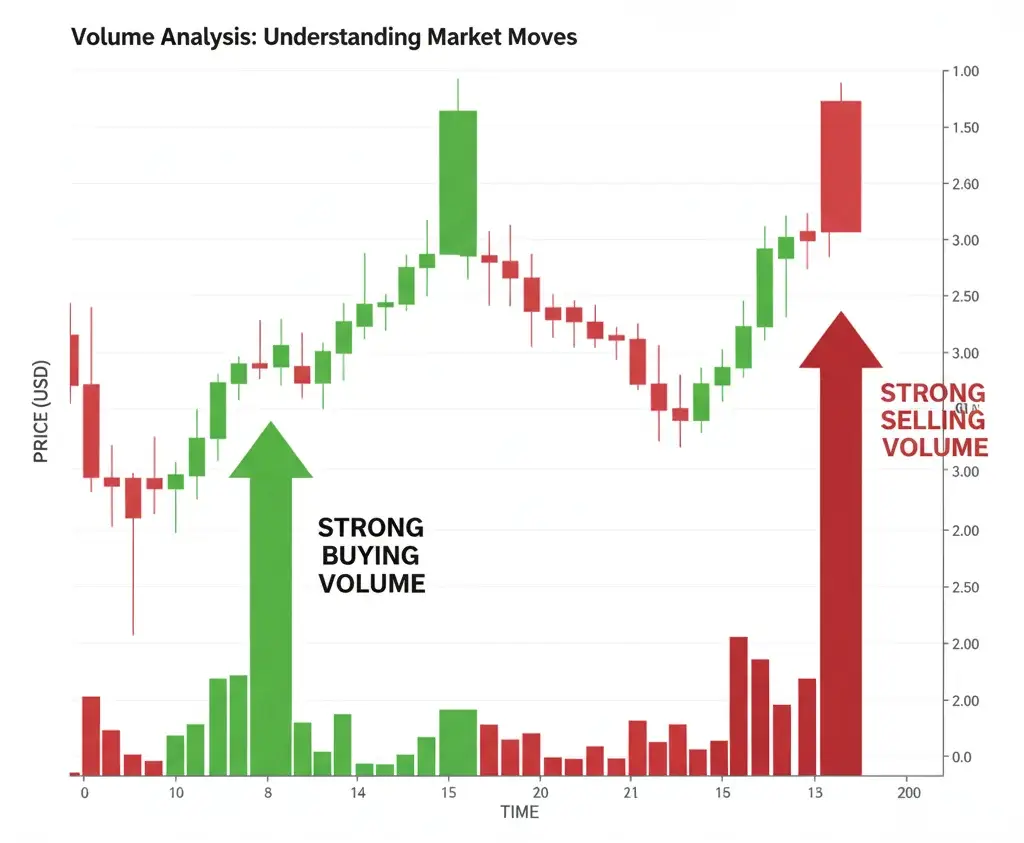
- Potential for Reversals: A sudden, massive spike in volume after a long trend can signal a “capitulation” or “climax” event, often preceding a trend reversal. For example, a huge spike in selling volume after a long downtrend might indicate that panicked sellers are finally exhausted, clearing the way for buyers to step in.
How to Read Trading Volume on a Crypto Chart?
On most trading platforms like TradingView, volume is displayed as a bar chart at the bottom of the price chart. Each bar corresponds to the price candle directly above it for the same time period.
- Green Volume Bar: Typically means the closing price for that period was higher than the opening price (a green price candle).
- Red Volume Bar: Typically means the closing price was lower than the opening price (a red price candle).
The height of the bar is what matters most—it represents the total volume traded, regardless of whether the price went up or down.
High Volume vs. Low Volume: What Do They Signal?
Interpreting volume is all about context. Here’s a quick cheat sheet:
- High Volume Signals (High Conviction):
- Bullish: A sharp price increase on high volume suggests strong buying interest and a healthy uptrend.
- Bearish: A sharp price decrease on high volume suggests strong selling pressure and a healthy downtrend.
- Reversal: A massive volume spike at the top or bottom of a trend can indicate a turning point, sometimes pushing the asset to new ATH prices.
- Low Volume Signals (Low Conviction / Uncertainty):
- Warning Sign: A price increase on low volume suggests a lack of buyer enthusiasm and may be a “fakeout” or trap.
- Warning Sign: A price decrease on low volume indicates sellers aren’t aggressive, and the downtrend may be losing steam.
- Consolidation: Low, quiet volume during a sideways price movement often precedes a significant breakout in either direction. Traders are waiting for a catalyst.
Ready to Elevate Your Trading?
You have the information. Now, get the platform. Join thousands of successful traders who use Volity for its powerful tools, fast execution, and dedicated support.
Create Your Account in Under 3 MinutesThe Relationship Between Volume and Price Action
The interplay between price and volume gives traders a clearer picture of market dynamics and can temporarily influence the circulating supply available to traders. We can break this down into four main scenarios, which are crucial for technical analysis.
| Price is Rising | Price is Falling | |
| Volume is High | Strong Uptrend (Bullish)<br>High buying pressure confirms the trend. This is the healthiest sign for a continued move up. | Strong Downtrend (Bearish)<br>High selling pressure confirms the trend. This is the healthiest sign for a continued move down. |
| Volume is Low | Weak Uptrend (Caution)<br>Lack of buying interest suggests the move may not be sustainable. High risk of a reversal or “fakeout.” | Weak Downtrend (Potential Reversal)<br>Lack of selling pressure suggests the downtrend is losing momentum. Sellers are exhausted. |
Understanding this quadrant is fundamental. A price move on low volume is suspicious. A price move on high volume demands your attention.
4 Practical Strategies for Using Volume in Your Trading
Knowing the theory is one thing; applying it is another. Here are four actionable strategies you can use to incorporate volume analysis into your trading today.
Strategy 1: Confirming a Trend’s Strength
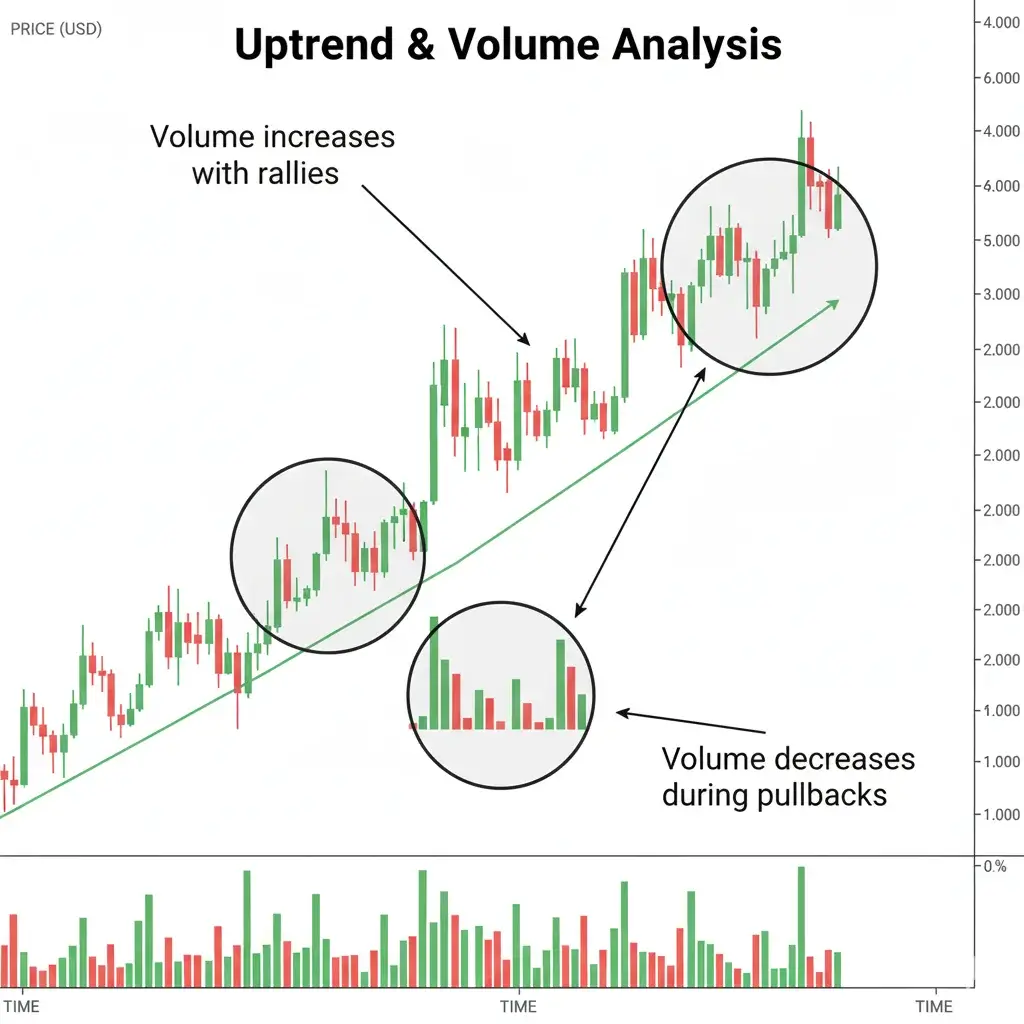
When a cryptocurrency is in a clear uptrend (making higher highs and higher lows), you want to see volume confirm this pattern.
- What to Look For:
- Volume should increase as the price rises (on green candles).
- Volume should decrease as the price pulls back or consolidates (on red candles).
- How it Works: This pattern shows that bulls are aggressive and in control during upward moves, while bears are weak during pullbacks. If you see the opposite—volume increasing on pullbacks and decreasing on upswings—it’s a major red flag that the trend is weakening.
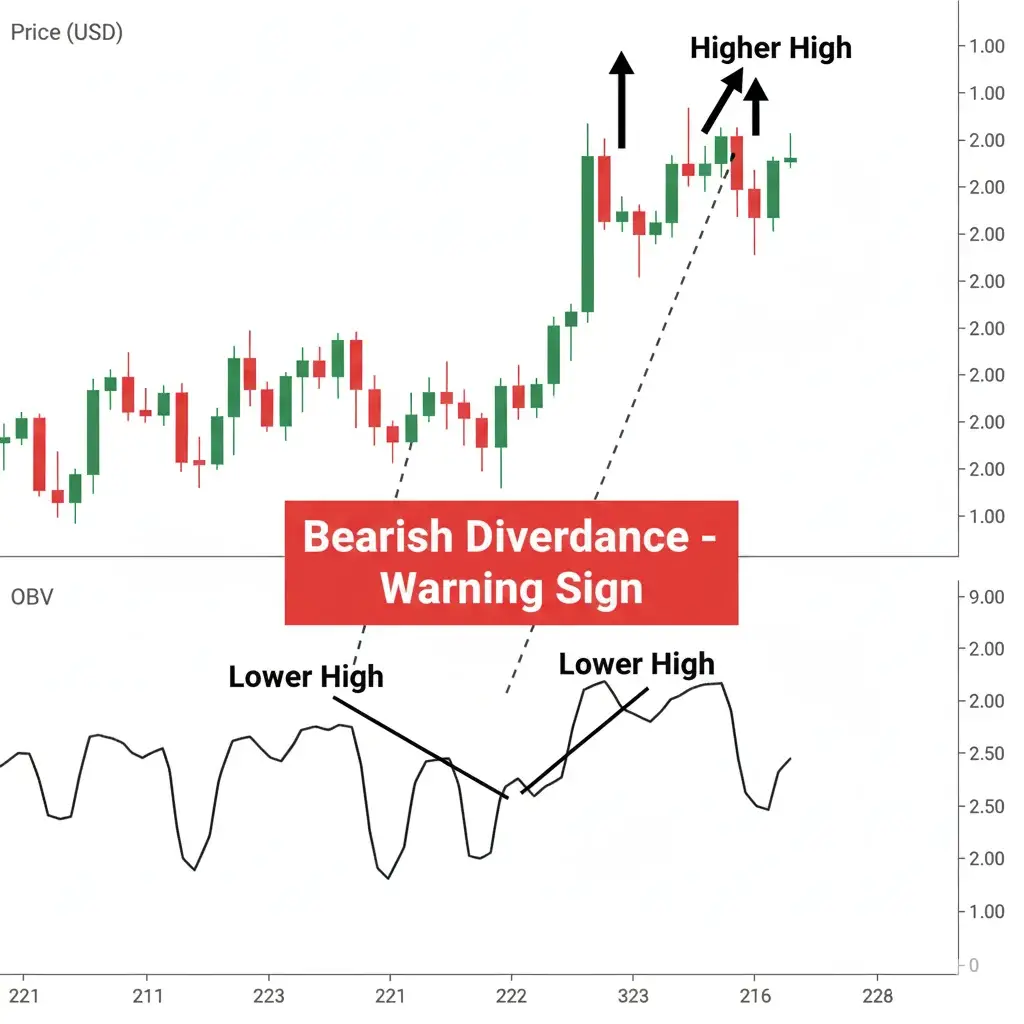
Strategy 2: Spotting Potential Reversals
Volume can be an excellent early warning system for a trend change. This often happens through a concept called divergence.
- What to Look For (Bearish Divergence):
- The price makes a new higher high.
- Simultaneously, volume makes a lower high.
- How it Works: The price is still rising, but the lack of volume shows that fewer participants are pushing it higher. This exhaustion is a classic sign that the uptrend is running out of steam and a reversal could be imminent. The same logic applies in reverse for a bullish reversal at the bottom of a downtrend.
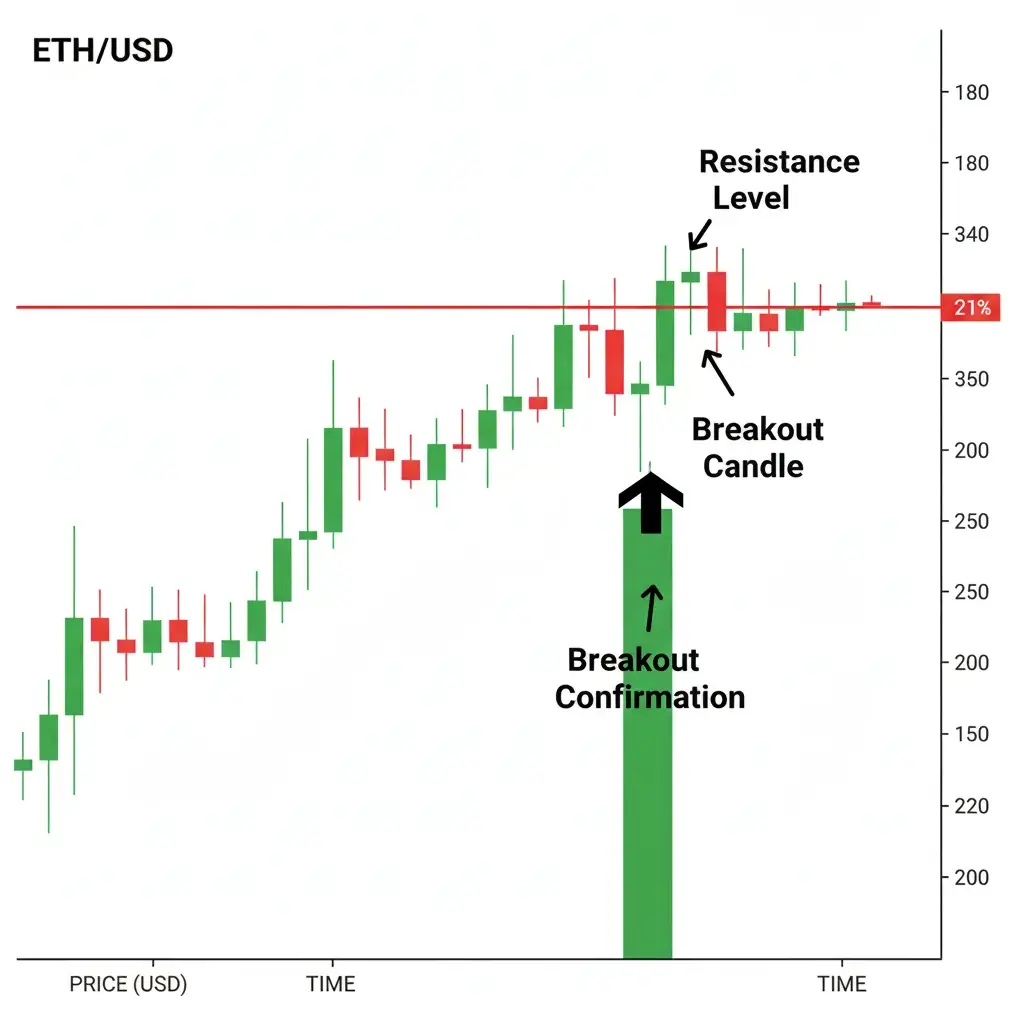
Strategy 3: Identifying High-Conviction Breakouts
A breakout occurs when the price moves decisively above a resistance level or below a support level. Volume is the single best tool for determining if a breakout is real or a “fakeout.”
- How to Confirm a Breakout in 3 Steps:
- Identify a Key Level: Find a clear resistance or support level where the price has reacted multiple times.
- Watch for the Break: Wait for a price candle to close decisively above resistance (or below support).
- Check the Volume: Look for a significant spike in volume on the breakout candle. This volume should be noticeably higher than the average volume of the preceding periods.
- Why it Works: The surge in volume shows a sudden rush of market participation, confirming that a large number of traders agree with the new price direction. A breakout on low volume is highly likely to fail and reverse back into the previous range.
Strategy 4: Avoiding Low-Liquidity Traps
Volume is a direct proxy for liquidity. Trading low-volume, illiquid altcoins is one of the fastest ways for new traders to lose money.
- What to Look For:
- Consistently low volume bars on the daily chart.
- Large, sudden price spikes or drops with very little corresponding volume.
- A wide gap between the buy price (bid) and sell price (ask) on the order book.
- How it Works: In low-liquidity markets, a single large order can cause a massive price swing. This leads to extreme volatility and high slippage, where the price you get is far worse than the price you clicked. Stick to assets with healthy, consistent daily volume to ensure you can enter and exit trades efficiently.
The Top 3 Volume Indicators Explained (With Examples)
Beyond the standard volume bars, traders use specialized indicators to get a more nuanced view of volume data. Here are the three most popular and effective ones.
On-Balance Volume (OBV): Following the “Smart Money”
The On-Balance Volume (OBV) indicator is a simple yet powerful tool that acts as a running total of an asset’s trading volume. It shows momentum by relating volume to price changes.
- How it’s calculated:
- If the price closes higher today than yesterday, today’s volume is added to the OBV.
- If the price closes lower today than yesterday, today’s volume is subtracted from the OBV.
- How to use it: The primary use of OBV is to spot divergence. If the price is making new highs but the OBV indicator is failing to make new highs, it’s a bearish divergence. This suggests that volume is not supporting the price rise, and the trend could be weakening. Conversely, a bullish divergence occurs when the price hits a new low, but OBV makes a higher low.
Volume-Weighted Average Price (VWAP): Identifying Fair Value
The Volume-Weighted Average Price (VWAP) calculates the average price of an asset over a specific period, weighted by volume. Institutional traders and day traders use it extensively to gauge the “fair value” of an asset for the current trading session.
- How it’s calculated: It’s the total dollar value of all trades for the day divided by the total number of shares/tokens traded.
- How to use it:
- Price below VWAP: Often considered a “good deal” or undervalued for the day. Buyers may look to enter positions.
- Price above VWAP: Often considered “expensive” or overvalued for the day. Sellers may look to take profits.
- VWAP as Support/Resistance: The VWAP line itself can act as a dynamic level of support or resistance during the trading day.
VWAP is most effective for short-term (intraday) analysis and resets at the beginning of each new trading session.
Volume Profile: Mapping Support and Resistance Zones
Unlike traditional volume bars that show volume over time, the Volume Profile indicator displays trading volume at different price levels. It’s shown as a horizontal histogram on the side of your chart.
- How it works: It reveals where the most and least trading activity has occurred.
- High-Volume Nodes (HVNs): These are price zones with high activity, indicating a “fair value” area where the price is likely to consolidate. They act as strong magnets for price and often become significant support or resistance levels.
- Low-Volume Nodes (LVNs): These are price zones with low activity. The price tends to move through these areas quickly.
- Point of Control (POC): This is the single price level with the highest traded volume, representing the “fairest” price in the selected range.
Volume Profile is excellent for identifying precise support and resistance zones that price-based indicators might miss.
The #1 Pitfall of Volume Analysis: Wash Trading
While volume is a powerful tool, its data can be misleading. The single biggest threat to the reliability of volume data in the crypto market is wash trading. Ignoring this can lead to costly trading errors based on fake signals.
What Is Wash Trading?
Wash trading is a form of market manipulation where an entity simultaneously buys and sells the same asset to create a false, misleading impression of market activity. In crypto, this is often done programmatically by a single actor (like a crypto exchange or a token project) using bots to trade with themselves.
Why would they do this?
- To Inflate Volume: Exchanges do it to climb the rankings on data aggregators like CoinMarketCap, making them appear more popular and liquid than they are to attract new users.
- To Create Hype: A new token project might use wash trading to make their asset seem like it has high demand, luring in unsuspecting retail investors who see the high volume and assume it’s legitimate.
This fake volume can make a low-liquidity asset appear highly liquid, and it can create volume spikes that traders might misinterpret as genuine breakout or reversal signals.
Turn Knowledge into Profit
You've done the reading, now it's time to act. The best way to learn is by doing. Open a free, no-risk demo account and practice your strategy with virtual funds today.
Open a Free Demo AccountHow to Spot Suspicious Volume and Find Reliable Data?
As a trader, you need to be skeptical and learn to filter the noise. Here’s how you can protect yourself:
- Use Reputable Data Aggregators: Don’t trust an exchange’s self-reported volume at face value. Use trusted sites like CoinGecko or CoinMarketCap, which have developed “Trust Score” or “Liquidity” metrics to filter out exchanges with suspicious volume. They adjust reported volumes to give you a more realistic picture.
- Compare Volume Across Multiple Exchanges: If a small, obscure exchange is reporting a higher Bitcoin volume than major players like Binance or Coinbase, it’s a massive red flag. Cross-reference the volume for an asset across several top-tier exchanges. Legitimate volume should be reasonably distributed.
- Look for Unnatural Patterns: Real trading volume is somewhat random and organic. Wash trading volume often looks robotic—like consistently similar-sized volume bars appearing at regular intervals, even during periods of low price volatility.
- Prioritize Top-Tier Assets: Wash trading is far more prevalent in low-cap, illiquid altcoins. While not immune, major cryptocurrencies like Bitcoin and Ethereum on reputable exchanges have much more reliable volume data due to genuine, deep liquidity.
By being aware of wash trading and using trusted data sources, you can ensure the volume data you’re analyzing reflects real market activity.