
Quick answer
Crypto market cap is the total value of a cryptocurrency, calculated by multiplying its current price by its circulating supply. It is used to compare the relative size of coins: large-cap coins like Bitcoin are more established and less volatile, while small-caps are riskier with higher growth potential. Market cap, not price per coin, shows a project’s true scale.
The Crypto Trading Starter Kit
A plain-English PDF: what to check before you trade, how orders and risk really work, and the mistakes to skip. Get it free.
Investing in financial products involves risk. Losses may exceed the value of your original investment.
Understanding the cryptocurrency market requires specific metrics. The single most important metric for measuring a cryptocurrency’s size, value, and dominance is its market capitalization, or “market cap.” It provides the essential context needed to compare different assets, assess risk, and understand the market’s true scale.
While understanding Crypto Market Cap is important, applying that knowledge is where the real growth happens. Create Your Free Forex Trading Account to practice with a free demo account and put your strategy to the test.
What is Crypto Market Cap?
Crypto market cap is the total value of a cryptocurrency’s circulating supply. It’s calculated by multiplying the current price per coin by the number of coins available to trade:
Market Cap = Price × Circulating Supply.
Market cap shows true size and risk better than price alone and is the standard way to compare coins. It’s also a natural extension of understanding what is crypto itself. since every digital asset’s value ultimately comes from how it’s traded, circulated, and perceived within blockchain economies.
Why Beginners Get Confused?
Beginners often confuse a coin’s individual price with its total value. A low price, such as $0.01, is frequently mistaken for a “cheap” asset with high growth potential. Market cap provides the true valuation, showing that a coin with a low price can still have a massive valuation if its circulating supply is high.
How to Calculate Crypto Market Cap?
To calculate crypto market cap, you multiply the current price of a single coin by its total circulating supply.
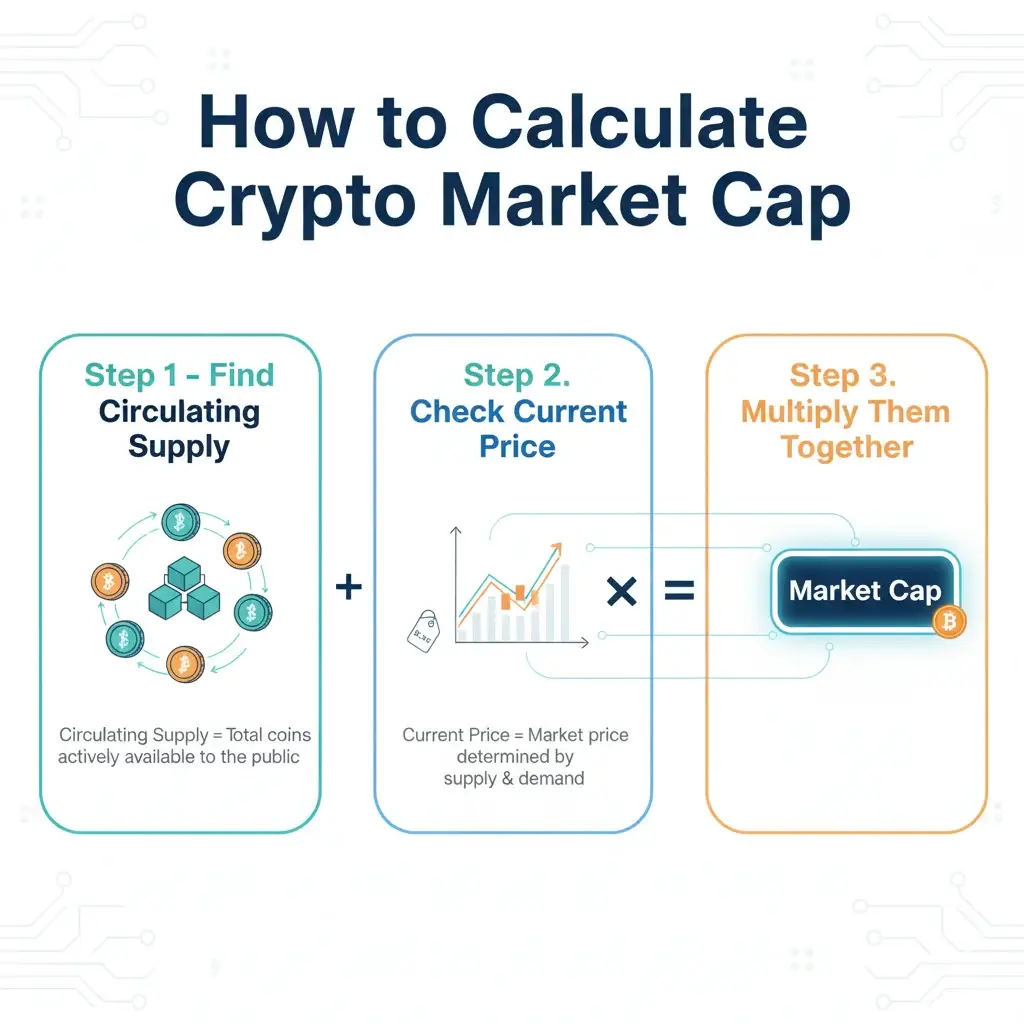
Step 1: Find Circulating Supply
First, determine the circulating supply. This entity is the total number of coins that are actively available to the public and trading on the market. This is a crucial metric, as it represents the supply that is actually accessible to investors. To learn how this number is calculated across different blockchains, see our detailed guide on circulating supply.
Step 2: Check Current Price
Second, identify the current market price of a single coin. This price is determined by real-time supply and demand across various cryptocurrency exchanges.
Step 3: Multiply Them Together
Third, multiply the circulating supply by the current price. The resulting number is the market capitalization.
Example: Bitcoin Market Cap
This example uses data from October 2025:
- Current Price (BTC): ~$113,146
- Circulating Supply (BTC): ~19.96 million
- Market Cap Calculation: $113,146 × 19.96 million = ~$2.256 Trillion (live BTC data: CoinGecko).
Example: Ethereum Market Cap (source: CoinGecko).
This example uses data from October 2025:
- Current Price (ETH): ~$4,010
- Circulating Supply (ETH): ~120.7 million
- Market Cap Calculation: $4,010 × 120.7 million = ~$483.99 Billion
However, daily crypto trading volume also plays a key role. influencing how quickly valuations adjust when demand or liquidity changes.
Market Cap vs. Price: The Crucial Difference
The crucial difference is that price represents the value of one unit, while market cap represents the total value of all units combined. Price alone is a misleading metric. Market cap is the accurate measure of a network’s overall size and value.
Why Cheap Coins Aren’t Always a Good Deal?
A coin is not a “good deal” just because its price is low. An asset priced at $0.01 can have a larger market cap than an asset priced at $1,000, if the $0.01 coin has a significantly larger circulating supply.
Dogecoin vs. Bitcoin Example
This comparison, using data from October 2025, illustrates the difference:
| Metric | Bitcoin (BTC) | Dogecoin (DOGE) |
| Current Price | ~$113,146 | ~$0.196 |
| Market Cap | ~$2.256 Trillion | ~$29.67 Billion |
Bitcoin’s price is over 577,000 times higher than Dogecoin’s price. Bitcoin’s market cap, however, is only 76 times higher. This disparity shows Dogecoin’s large valuation is due to its massive circulating supply.
Common Investor Mistake
The most common investor mistake is believing a low-priced coin (e.g., $0.00001) can easily reach $1. This assumption ignores the circulating supply. For a coin with 589 trillion tokens (like Shiba Inu), reaching $1 would require a $589 trillion market cap, a value that exceeds the combined value of all assets on Earth.
Ready to Elevate Your Trading?
You have the information. Now, get the platform. Join thousands of successful traders who use Volity for its powerful tools, fast execution, and dedicated support.
Create Your Account in Under 3 MinutesWhy Market Cap Matters More Than Price?
Market cap matters more than price because it provides a comprehensive measure of a cryptocurrency’s value, risk, and market dominance. It is the standard metric used for ranking and comparison.
Risk Assessment: Higher Cap = Lower Volatility
Market cap is a primary indicator of risk. Assets are grouped into 3 main categories:
- Large-Cap ($10B+): These are established assets, such as Bitcoin and Ethereum. They possess higher liquidity, have wider adoption, and show lower volatility compared to other assets.
- Mid-Cap ($1B – $10B): These assets offer potential for higher growth but carry increased risk.
- Small-Cap (<$1B): These are the most volatile assets and present the highest risk.
Ranking Cryptocurrencies Fairly
Market cap is the standard way to rank cryptocurrencies. A list sorted by price is meaningless because it ignores supply. Sorting by market cap accurately reflects the network’s collective value and market position.
Comparing Coins to Traditional Assets
Market cap allows for direct comparisons between cryptocurrencies and traditional assets. An investor can compare Bitcoin’s market cap (approx. $2.26T as of Oct 2025) to the market cap of large companies, such as Apple or Microsoft, or to the total market cap of precious metals, such as gold.
Market Cap in Portfolio Diversification
Investors use market cap to build a diversified portfolio. A common strategy involves allocating a high percentage to large-cap coins for stability. A smaller percentage is then allocated to mid-cap or small-cap coins for higher growth potential.
Market Cap Limitations & When It’s Misleading
Market cap is misleading when it does not account for the total future supply of a coin. It can also be manipulated in low-liquidity markets.
Fully Diluted Market Cap Trap
The Fully Diluted Market Cap (FDMC), or Fully Diluted Valuation (FDV), is a different metric. FDMC is calculated by multiplying the current price by the maximum possible supply of a coin, including tokens that are not yet unlocked.
FDMC = Current Price × Maximum Supply
A coin may have a low current market cap but a massive fully diluted market cap. This signals future inflation and downward price pressure as new tokens enter circulation.
Why Low Supply ≠ High Value
A low supply does not guarantee high value. An asset may have only 1 million coins, but if the project has no adoption, technology, or demand, its market cap will remain low. Remember, every valuation begins from the smallest divisible unit, like Bitcoin’s satoshis, which collectively scale into trillions when multiplied across circulating supply. Value is driven by demand relative to the supply.
Market Manipulation & Cap Gaming
Small-cap coins with low liquidity are susceptible to market manipulation. A small group of buyers can artificially inflate the price in a “pump-and-dump” scheme. This action temporarily inflates the market cap, creating a misleading appearance of high value before the price crashes.
Case Study: Shiba Inu Explosion
The Shiba Inu (SHIB) token launched with a massive supply. Despite its extremely low price, its market cap exploded during the 2021 bull run. On October 28, 2021, SHIB reached an all-time high price of $0.000086. This price, multiplied by its circulating supply of over 500 trillion tokens, gave it a market cap of over $40 billion, briefly placing it in the top 10 cryptocurrencies.
Market Cap Trends & Historical Context
Analyzing market cap trends provides context on investor sentiment and the market’s overall health.
BTC Dominance Trends
Bitcoin Dominance (BTC.D) is the ratio of Bitcoin’s market cap to the total crypto market cap. As of October 2025, this metric is approximately 59.1%.
- A rising BTC.D often signals a “flight to safety,” where investors sell riskier altcoins for Bitcoin.
- A falling BTC.D indicates investors are moving capital into altcoins, a period often called “altseason”.
Bull Runs & Crashes (2021–2024)
Historical data shows extreme market cycles. In November 2021, the total crypto market cap reached its peak at nearly $3 trillion. During the 2022 bear market, the total cap crashed below $1 trillion. These turning points often coincide with each asset’s all-time high crypto milestones. markers that show how exuberant capital inflows expand total market capitalization.
Peak vs. Crash Analysis
The 2021-2022 cycle demonstrates how market cap expands and contracts. Bitcoin’s own market cap peaked at ~$1.3 trillion in November 2021. By late 2025, the total market cap recovered to new highs of approximately $3.81 Trillion (source: CoinMarketCap).
Market Cap Ranking Tools & Resources
To track crypto market cap, use reliable, independent data aggregation websites.
Top 5 Cryptocurrencies by Market Cap
The Top 5 list represents the “large-cap” and “mid-cap” segments of the market. As of late 2025, the top 5 assets by market cap are:
- Bitcoin (BTC)
- Ethereum (ETH)
- Tether (USDT)
- XRP (XRP)
- BNB (BNB)
Reliable Data Sources (CoinMarketCap vs. CoinGecko)
The two most trusted data sources for market cap are CoinMarketCap and CoinGecko.
- CoinMarketCap: A widely used platform acquired by the Binance exchange.
- CoinGecko: Known as the world’s largest independent crypto data aggregator.
Live Ranking Tracker Tools
These tools are available on all major aggregators and exchanges.
Turn Knowledge into Profit
You have done the reading, now it is time to act. The best way to learn is by doing. Open a free, no-risk demo account and practice your strategy with virtual funds today.
Open a Free Demo AccountBottom Line
Market capitalization is the most reliable indicator of a cryptocurrency’s true size and stability. While price can mislead, market cap reflects both investor sentiment and risk. It bridges short-term hype with long-term fundamentals, helping traders and beginners compare assets fairly, identify overvalued projects, and diversify intelligently. Always start your crypto research by looking at market cap, it’s the foundation of every sound investment decision.
FAQ: Common Market Cap Questions
Frequently Asked Questions
What our analysts watch: We track three signals when reading the crypto tape. Spot ETF net flows reveal institutional demand. Stablecoin issuance shows sidelined buying power. Miner reserves indicate supply pressure.
Volity operates a trading platform and also publishes educational and analytical content about trading. The content on this page is for educational purposes only and should not be considered financial advice. Volity may benefit commercially when readers open trading accounts through links on this site.
Our content is produced and reviewed under documented editorial standards; comparison and review methodology is published here.