Trade Triangle Signale können bei stark volatilen Marktverwerfungen verzögert auftreten, was dazu führt, dass Trader bei Gewinnsignalen zu spät einsteigen und nur einen Teil der Kursgewinne mitnehmen. Monatliche Triangle-Ausbrüche sind anfällig für Fehlsignale, wenn das Volumen während der Sitzungsüberschneidungen gering ist, was zu sogenannten Whipsaws führt, die Stop-Loss-Orders auslösen, bevor sich Aufwärtstrends bestätigen. Der „Chart Analysis Score“ kann bei stimmungsgetriebenen Rallyes die jüngste Preisbewegung übergewichten, was Trader dazu verleitet, an lokalen Höchstständen von maximaler Überzeugung auszugehen. Krypto-Charts zeigen aufgrund der 24/7-Volatilität und der im Vergleich zu Aktien geringeren institutionellen Beteiligung eine deutlich geringere Zuverlässigkeit der Trade Triangles. Sich ausschließlich auf das Trade Triangle System ohne fundamentalen Kontext oder Risikomanagement zu verlassen, führt bei längeren Konsolidierungsphasen zu übermäßiger Hebelwirkung und zum Totalverlust des Kontos. Die Wertentwicklung in der Vergangenheit ist kein Indikator für zukünftige Ergebnisse. Kapital ist gefährdet.
Die Trade Triangle Methodik ist ein proprietäres technisches System, das Markttrends über drei verschiedene Zeitrahmen hinweg identifiziert. Dieser Ansatz funktioniert am besten, wenn monatliche und wöchentliche Signale bei hochliquiden Vermögenswerten übereinstimmen. Trader nutzen den Chart Analysis Score des Systems, um seitwärts gerichtetes Rauschen herauszufiltern und die institutionelle Beteiligung bei Aktien und Rohstoffen zu bestätigen.
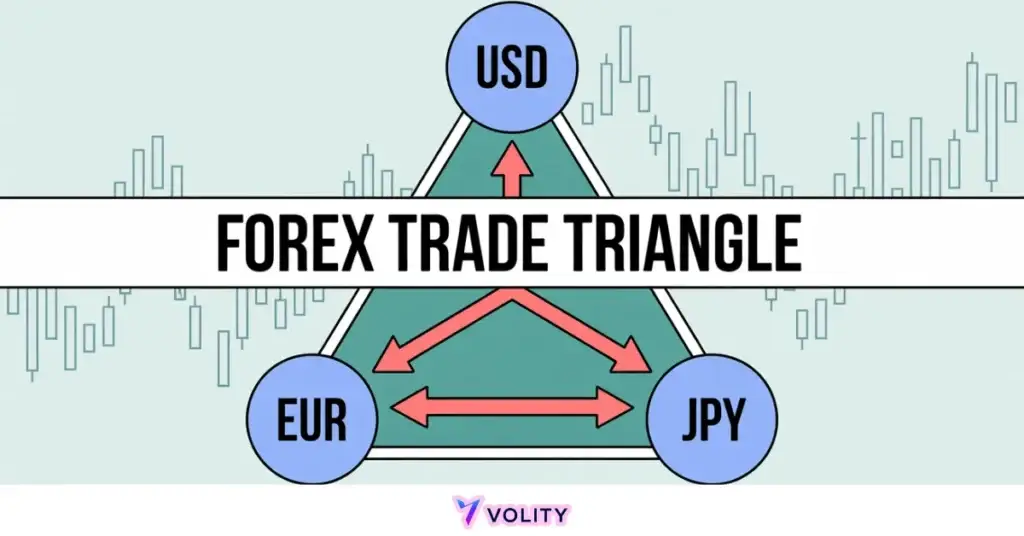
Die Trade Triangle Methodik fungiert als umfassender trendfolgender Rahmen für moderne Finanzmärkte. Dieses System nutzt einen proprietären Algorithmus, der auf Preisbewegungen und Momentum basiert, um grüne (bullische) und rote (bärische) Signale über mehrere Zeitrahmen hinweg zu generieren. Im Handelsumfeld von 2026 dient es als kritisches Werkzeug für Swing-Trader, die Whipsaws in volatilen Sektoren vermeiden möchten.
Der Erfolg mit dem Trade Triangle hängt von der strikten Ausrichtung der langfristigen Tendenz auf das mittelfristige Timing ab. Durch das Herausfiltern kurzfristiger Schwankungen ermöglicht das System Tradern, sich auf die beständigsten Markttrends in den Bereichen Forex, Krypto und Aktien zu konzentrieren.
Das Verständnis von Trade Triangle Methodology ist wichtig, doch echtes Wachstum entsteht erst durch die Anwendung dieses Wissens. Kostenloses Forex-Handelskonto erstellen, um mit einem kostenlosen Demokonto zu üben und Ihre Strategie zu testen.
Was sind Trade Triangles und wie funktionieren sie?
Trade Triangles sind proprietäre technische Indikatoren, die Markttrends in langfristige, mittelfristige und kurzfristige Signale basierend auf Preisbewegungen und Momentum kategorisieren. Das System identifiziert drei verschiedene hierarchische Ebenen, von denen jede einen spezifischen Zweck im Entscheidungsrahmen erfüllt.
- Monatliche Triangles bestimmen den Makrotrend und legen die „Go/No-Go“-Zone fest, ein Trader sollte niemals Long-Positionen eröffnen, wenn das monatliche Triangle rot anzeigt.
- Wöchentliche Triangles liefern das „Timing“-Signal für Einstiege und Wiedereinstiege und lösen die tatsächliche Ausführung innerhalb der monatlichen Richtungsneigung aus.
- Tägliche Triangles steuern kurzfristige Volatilität und Intraday-Ausstiegspunkte, wodurch Trader ihr Positionsmanagement optimieren können, während sie den übergeordneten Trend respektieren.
Die Trade Triangle Technologie wurde entwickelt, um den „Kern“ einer Swing-Bewegung zu erfassen, wobei der Fokus auf Haltedauern von 3 Wochen bis 3 Monaten liegt (Top Trade Reviews: MarketClub Trade Triangle Analysis 2026). Dieser erweiterte Zeitrahmen steht in scharfem Kontrast zu Scalping-Strategien, die dem Intraday-Rauschen hinterherjagen.
Der Algorithmus hinter dem Signal
Der Trade Triangle Algorithmus identifiziert Trendverschiebungen durch die Analyse der Beziehung zwischen Preisdurchbrüchen und historischen Volatilitätsregimen. Das System misst, ob der Preis über oder unter früheren Swing-Hochs und -Tiefs schließt, und bestimmt, ob das Momentum anhält oder erschöpft ist. Preisdurchbrüche über 3-Monats-Hochs signalisieren, dass institutionelle Käufer Kapital binden, während Durchbrüche unter 3-Monats-Tiefs die Dominanz der Verkäufer anzeigen. Im algorithmischen Markt von 2026 trennt dieser Filteransatz die echte institutionelle Absicht vom hochfrequenten Rauschen, das kürzere Zeitrahmen dominiert.
Gleitende Durchschnitte und andere traditionelle Indikatoren erzeugen oft widersprüchliche Signale über verschiedene Zeitrahmen hinweg, was zu einer Analyse-Paralyse führt. Trade Triangles beseitigen diese Verwirrung, indem sie ein einziges, einheitliches Signal liefern, das automatisch mehrere Zeitrahmen in eine richtungsweisende Empfehlung integriert, deshalb bleibt das System ein grundlegendes Werkzeug für die Bewertung von Moving Average Crossovers.
Bereit, Ihr Trading auf das nächste Level zu bringen?
Sie haben das Wissen. Jetzt fehlt die Plattform. Schließen Sie sich Tausenden erfolgreichen Tradern an, die Volity für leistungsstarke Tools, schnelle Ausführung und engagierten Support nutzen.
Erstellen Sie Ihr Konto in unter 3 MinutenDie Trade Triangle Strategie 2026: Die monatlich-wöchentliche Ausrichtung
Die effektivste Trade Triangle Strategie im Jahr 2026 erfordert, dass Long-Positionen nur dann eingegangen werden, wenn sowohl die monatlichen als auch die wöchentlichen Signale grün sind. Diese Anforderung von zwei Signalen verbessert die Gewinnraten drastisch, indem falsche Ausbrüche herausgefiltert werden, die durch vorübergehende tägliche Preisspitzen ohne echte institutionelle Beteiligung ausgelöst werden.
Schritt 1 beinhaltet das Filtern durch das monatliche Triangle, um die Richtungsneigung festzulegen. Ein Trader bestätigt, dass das monatliche Triangle grün anzeigt, bevor er einen Einstieg in Betracht zieht, dies ist das nicht verhandelbare Richtungsfundament. Schritt 2 erfolgt über das wöchentliche Triangle, das als primärer Einstiegsauslöser dient. Sobald der Monat die Richtung bestätigt, warten Trader darauf, dass das wöchentliche Triangle grün wird, und eröffnen erst dann Positionen bei Markteröffnung nach dem Signal. Schritt 3 erfordert die Verwaltung des Trades durch Ausstieg, wenn das wöchentliche Triangle rot wird, unabhängig von den Preisniveaus, diese Disziplin verhindert, dass Trader Verlierer zu lange halten oder nur Teilgewinne mitnehmen.
Die Anhebung der EBITDA-Prognose für 2026 von Plains All American Pipeline (PAA) auf 2,88 Mrd. USD bietet einen fundamentalen Rückenwind für Trader, die ihrem grünen monatlichen Triangle-Signal folgen (TradingView PAA 2026 Guidance). Die Konvergenz von technischer und fundamentaler Stärke schafft Einstiege mit hoher Überzeugung, die institutionelle Investoren respektieren.
Technische Indikatoren für den Handel-Frameworks sind darauf optimiert, diese Multi-Zeitrahmen-Ausrichtungen zu identifizieren, was es Tradern ermöglicht, die Signalerkennung zu automatisieren, anstatt manuell Charts über Dutzende von Instrumenten hinweg zu überprüfen.
Handeln Sie niemals gegen das monatliche Triangle; im Jahr 2026 treten über 80 % der gescheiterten Trade Triangle Setups auf, wenn ein Trader versucht, den „Boden zu timen“, indem er einem täglichen oder wöchentlichen Signal folgt, das dem monatlichen Trend widerspricht.
Verständnis des Chart Analysis Score im Jahr 2026
Der Chart Analysis Score identifiziert die Stärke und Beständigkeit eines Markttrends auf einer Skala von -100 bis +100. Diese einzelne numerische Metrik komprimiert alle drei Zeitrahmensignale in einen Überzeugungsindikator, der es Tradern ermöglicht, die Wahrscheinlichkeit zu quantifizieren, dass eine Bewegung das Momentum beibehält, anstatt schnell umzukehren.
Ein Chart Analysis Score von +100 repräsentiert das stärkste bullische Regime, in dem tägliche, wöchentliche und monatliche Signale alle grün sind, was darauf hinweist, dass kurzfristige Trader, mittelfristige Akteure und langfristiges institutionelles Geld alle in die gleiche Richtung ausgerichtet sind. Ein Score von -100 offenbart das Gegenteil, alle drei Zeitrahmen zeigen rot und signalisieren einstimmige bärische Überzeugung. Die „Seitenlinien-Zone“ zwischen -50 und +50 deutet auf widersprüchliche Signale über Zeitrahmen hinweg hin, bei denen die Whipsaw-Wahrscheinlichkeit steigt, da Trader, die auf unterschiedlichen Zeitrahmen operieren, widersprüchliche Marktsichten haben.
Gold (XAU/USD) löste im 1. Quartal 2026 ein grünes monatliches Triangle mit einem Chart Analysis Score von +85 aus, was auf eine starke bullische Ausrichtung hindeutet. Der Preis stieg über 8 Wochen von 2.400 USD auf 2.750 USD, wobei der Trader erst ausstieg, nachdem das wöchentliche Triangle bei 2.720 USD auf Rot drehte. Die Wertentwicklung in der Vergangenheit ist kein Indikator für zukünftige Ergebnisse. Dieses Beispiel zeigt, wie die strikte Einhaltung der Signalhierarchie zu nachhaltigen, mehrwöchigen Trendmitnahmen führt, anstatt zu Whipsaw-Einstiegsversuchen.
Leistungskennzahlen
Historische Backtests des Trade Triangle Systems identifizieren eine klare Hierarchie der Gewinnraten über verschiedene Anlageklassen hinweg im Markt von 2026. Die Daten zeigen, dass die institutionelle Beteiligung und die Trendbeständigkeit je nach Instrument erheblich variieren, was erfordert, dass Trader die Positionsgrößen und Haltedauererwartungen auf Basis historischer Wahrscheinlichkeiten anpassen.
| Anlageklasse | Beste Strategie | Haltedauer |
| Blue-Chip Aktien | Monatlich + Wöchentlich | 4 – 12 Wochen |
| Gold (Rohstoffe) | Monatlich + Wöchentlich | 3 – 8 Wochen |
| Forex (Majors) | Wöchentlich + Täglich | 3 – 10 Tage |
| Krypto (BTC/ETH) | Monatlich + Wöchentlich | 2 – 6 Wochen |
| Small-Cap Growth | Nur Monatlich | 1 – 4 Wochen |
Die besseren Ergebnisse bei Blue-Chip-Aktien spiegeln eine tiefe institutionelle Beteiligung und eine starke Trendbeständigkeit wider, während die schwächeren Ergebnisse bei Small-Cap-Growth-Aktien zeigen, dass diese volatileren Instrumente mehr Seitwärtsbewegungen erzeugen, die das System verwirren. Trade Triangle Signale bei Small-Caps erfordern vor der Ausführung eine zusätzliche Bestätigung durch fundamentale Katalysatoren.
WARNING: Signalzerfall ist ein signifikanter Faktor im Jahr 2026; Daten deuten darauf hin, dass Trade Triangle Signale nach 14 Handelstagen etwa 40 % ihrer Vorhersagekraft verlieren, was erfordert, dass Trader innerhalb von zwei Wochen nach Einstieg entweder Gewinne mitnehmen oder Stops straffen.
Die „Zwei-Wochen-Regel“ und Signalzerfall im Jahr 2026
Signalzerfall identifiziert das 14-Tage-Fenster, in dem die Vorhersagekraft eines Trade Triangle Ausbruchs am größten ist, bevor die Volatilität zunimmt. Die meisten Swing-Trading-Gewinne treten innerhalb der ersten zwei Wochen eines Ausbruchssignals auf, da sich das Momentum in dieser Zeit am schnellsten zusammensetzt. Nach Tag 14 beginnen institutionelle Trader, die Positionen beim Ausbruch eröffnet haben, Teilgewinne mitzunehmen, und die Stops von Retail-Tradern häufen sich in der Nähe von Widerstandsniveaus, was zu Whipsaw-Bedingungen führt.
Warum beschleunigt die algorithmische Effizienz von 2026 den Signalzerfall? Hochfrequenzalgorithmen scannen Trade Triangle Signale in Echtzeit und laufen Retail-Einstiegen innerhalb von Millisekunden nach Erscheinen des Signals den Rang ab. Dies erzeugt eine künstliche Beschleunigung, bei der die ersten 30 % der Bewegung in den ersten 48 Stunden abgeschlossen sind, was langsameren Tradern eine geringere Gewinnmitnahme lässt. Das Straffen von Stops nach 10 Handelstagen sichert „Kern“-Gewinne und schützt vor einer Rückkehr zum Mittelwert nach einem ausgedehnten Triangle-Lauf. Das Risiko einer Mean-Reversion ist am 14-Tage-Wendepunkt am höchsten, wenn Momentum-Erschöpfung mit Gewinnmitnahmen mehrerer institutioneller Akteure zusammenfällt.
Fortgeschrittene technische Analyse-Frameworks lehren, dass Signalzerfall ein universelles Gesetz ist, das auf alle trendfolgenden Systeme anwendbar ist und nicht nur auf Trade Triangles.
💡 KEY INSIGHT: Der Chart Analysis Score (+100 bis -100) ist der ultimative Filter für das Trade Triangle System; führen Sie Trades nur aus, wenn der Score über +75 (bullisch) oder unter -75 (bärisch) liegt, um sicherzustellen, dass Sie in ein Regime mit hohem Momentum einsteigen.
Wissen in Gewinn verwandeln
Sie haben gelesen, jetzt ist es Zeit zu handeln. Der beste Weg zu lernen ist durch Praxis. Eröffnen Sie ein kostenloses, risikofreies Demokonto und üben Sie Ihre Strategie noch heute mit virtuellem Guthaben.
Kostenloses Demokonto eröffnenEinschränkungen
Whipsaw-Regime stellen den primären Fehlermodus für das Trade Triangle System während Perioden geringer Volumenskonsolidierung dar. Wenn ein Vermögenswert in eine Seitwärtsbewegung mit widersprüchlichen monatlichen/wöchentlichen Signalen eintritt, generiert das System widersprüchliche Empfehlungen, die das Kontokapital durch wiederholte falsche Einstiege belasten. Diese unruhigen Umgebungen treten am häufigsten während der Ankündigungsphasen der Zentralbanken oder während des Übergangs von Bullen- zu Bärenregimen auf.
Die nachlaufende Natur des Trade Triangle Systems stellt seine Kernschwäche dar: Es verpasst die ersten 10 % einer Bewegung, weil der Algorithmus auf bestätigtes Momentum wartet, anstatt Tops oder Bottoms vorherzusagen. Trader müssen akzeptieren, dass sie niemals das exakte Tief einer Umkehr erwischen werden, stattdessen erfassen sie den „bestätigten“ Teil der Bewegung, in dem die institutionelle Beteiligung unbestreitbar ist. Seitwärtsmärkte bergen das höchste operationelle Risiko, da das System knappe Entscheidungen generiert, bei denen das monatliche Signal grün bleibt, der Preis aber nicht vorankommt, was Trader dazu veranlasst, Verlierer über ihre beabsichtigte Haltedauer hinaus zu halten.
Disziplin beim Risikomanagement im Handel wird in diesen Versagensphasen unerlässlich, da sie es Tradern ermöglicht, verlierende Positionen zu schließen, bevor sie in kontozerstörende Drawdowns eskalieren. Marktvolatilität korreliert direkt mit der Häufigkeit von Trade Triangle Fehlern, Umgebungen mit hoher Volatilität erzeugen mehr Fehlsignale und schnellere Drawdowns.
Wichtige Erkenntnisse
- Die Trade Triangle Methodik ist ein proprietäres Multi-Zeitrahmen-System, das monatliche, wöchentliche und tägliche Signale verwendet, um Markttrends zu verfolgen.
- Monatliche Triangles sind die nicht verhandelbaren Trendfilter, die verwendet werden, um die langfristige Richtungsneigung für jeden Trade im Jahr 2026 zu definieren.
- Wöchentliche Triangles dienen als primärer Ausführungsauslöser für den Einstieg und Ausstieg bei Swing-Trades innerhalb des etablierten Monatstrends.
- Chart Analysis Scores im Bereich von +100 bis -100 identifizieren die Stärke eines Trends und helfen Tradern, unruhige Seitwärtsmärkte zu vermeiden.
- Die besten Ergebnisse lassen sich bei hochliquiden Vermögenswerten wie Gold und Blue-Chip-Aktien erzielen, wenn die Zeitrahmenausrichtung strikt eingehalten wird.
- Die 14-Tage-Zerfallregel warnt davor, dass der wahrscheinlichste Teil einer Triangle-basierten Bewegung typischerweise innerhalb der ersten zwei Wochen auftritt.
Häufig gestellte Fragen
Dieser Artikel enthält Verweise auf die Trade Triangle Methodik, MarketClub und Volity, eine regulierte CFD-Handelsplattform. Dieser Inhalt wurde nur zu Bildungszwecken erstellt und stellt keine Finanzberatung oder Empfehlung zum Kauf oder Verkauf eines Finanzinstruments dar. Überprüfen Sie immer den aktuellen regulatorischen Status und die Plattformdetails, bevor Sie einen Handelsdienst nutzen. Einige Links in diesem Artikel können Affiliate-Links sein.