Pivot-Point-Level werden häufig von institutionellen Algorithmen für „Stop-Runs“ anvisiert, die über strukturelle Unterstützungs- und Widerstandszonen hinausgehen, bevor eine scharfe Umkehr erfolgt. Die Verwendung der falschen Sitzungsschlusszeit (Tokio-Schluss statt New Yorker Schluss) erzeugt inkorrekte Pivot-Level, die nicht mit den globalen Interbanken-Berechnungen übereinstimmen. Signale der engen Central Pivot Range (CPR) können falsch sein, wenn sie nach Sitzungen mit geringem Volumen entstehen und falsche Erwartungen an Ausbrüche wecken. Sich ausschließlich auf Pivot-Punkte ohne den Kontext struktureller Unterstützung zu verlassen, führt bei wichtigen Nachrichtenveröffentlichungen zu hohen Ausfallraten, wenn Preislücken die berechneten Level entwerten. Die Wertentwicklung in der Vergangenheit ist kein Indikator für zukünftige Ergebnisse. Kapital ist gefährdet.
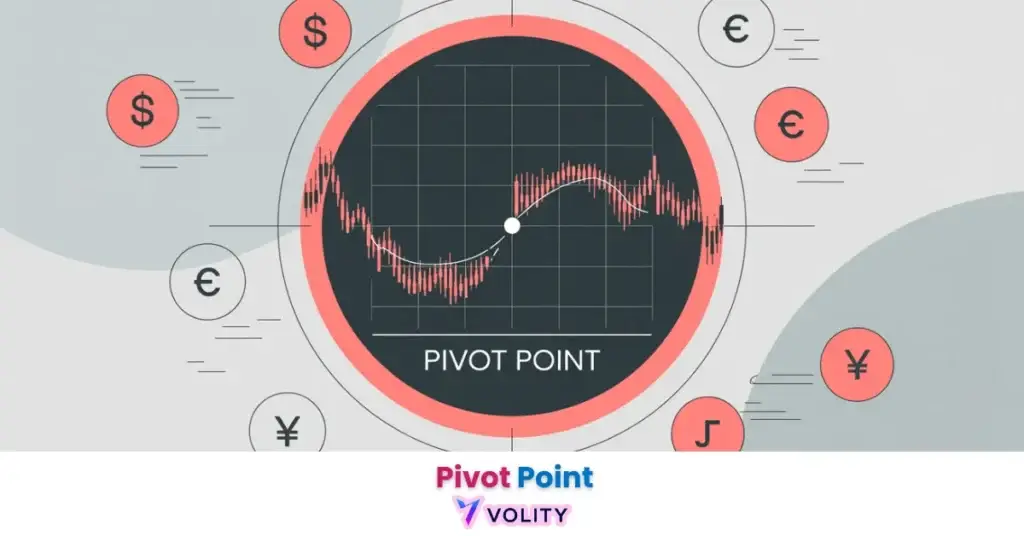
Pivot-Punkte sind berechnete Preisniveaus, die von Intraday-Tradern verwendet werden, um potenzielle Unterstützung, Widerstand und die Marktrichtung zu identifizieren. Diese objektiven Marker, die aus dem Hoch, Tief und Schlusskurs der vorangegangenen Sitzung abgeleitet werden, dienen als selbsterfüllende Prophezeiung auf dem 9,6 Billionen USD schweren täglichen Forex-Markt. Im Jahr 2026 ist die Beherrschung der Unterscheidung zwischen Standard- und fortgeschrittenen Pivot-Methoden wie Camarilla unerlässlich, um sich während der Liquiditätsspitzen am institutionellen Orderfluss auszurichten.
Pivot-Punkte fungieren als „Navigationsmarker“ des Handelstages und ermöglichen es Anlegern, Grenzen für den Support- und Resistance-Handel vor Marktöffnung festzulegen. Dieses System identifiziert die kritischen Schwellenwerte, an denen die Marktstimmung von bullisch auf bärisch umschlägt und umgekehrt. Es dient als grundlegendes Werkzeug sowohl für diskretionäre als auch für algorithmische Handelssysteme.
Die Investitionslandschaft des Jahres 2026 betont die Bedeutung objektiver Daten, um das Rauschen des Hochfrequenzhandels herauszufiltern. Die Beherrschung der Beziehung zwischen dem zentralen Pivot und seinen symmetrischen Unterstützungs- und Widerstandsniveaus ermöglicht es Tradern, mit hoher Wahrscheinlichkeit auf Konfluenz zu setzen.
Das Verständnis von Pivot Point in Forex ist wichtig, doch echtes Wachstum entsteht erst durch die Anwendung dieses Wissens. Kostenloses Forex-Handelskonto erstellen, um mit einem kostenlosen Demokonto zu üben und Ihre Strategie zu testen.
Was ist ein Pivot-Punkt im Forex-Handel?
Ein Pivot-Punkt ist ein berechnetes Intraday-Referenzniveau, das verwendet wird, um wahrscheinliche Preisreaktionszonen und die aktuelle Richtungsneigung eines Währungspaares zu bestimmen.
Der Effekt der „selbsterfüllenden Prophezeiung“ erklärt, warum Pivots zuverlässig funktionieren. Da die weite Verbreitung bedeutet, dass über 70 % der Intraday-Trader dieselben Niveaus beobachten, tendiert der Preis auf natürliche Weise zu diesen Zonen und reagiert dort. Die symmetrische Projektion erstellt die tägliche Preiskarte durch drei Unterstützungsniveaus (S1-S3) und drei Widerstandsniveaus (R1-R3), die symmetrisch um den zentralen Pivot positioniert sind.
- Der Effekt der „selbsterfüllenden Prophezeiung“: Warum weite Verbreitung Pivots funktionieren lässt
- Symmetrische Projektion: Wie S1-S3 und R1-R3 die tägliche Preiskarte aufbauen
- Tägliche vs. wöchentliche vs. monatliche Pivots: Anpassung des Niveaus an den Handelszeitrahmen
Die globale FX-Liquidität erreicht ihren Höhepunkt während der Sitzungen, in denen der Preis mit dem zentralen täglichen Pivot interagiert, was oft zu einem Umsatz von über 500 Milliarden USD innerhalb einer Spanne von 5 Pips führt (BIS 2026 Liquidity Study, 2026).
Die Central Pivot Range (CPR)
Die Central Pivot Range ist eine Drei-Level-Zone, die die Stärke des Intraday-Trends und die wahrscheinliche Spanne der Handelssitzung identifiziert.
Diese Zone besteht aus dem Top CPR (dem höchsten berechneten Widerstand), dem Central Pivot (dem Mittelpunkt) und dem Bottom CPR (der niedrigsten berechneten Unterstützung). Eine enge CPR signalisiert explosives Ausbruchspotenzial, der Preis wird wahrscheinlich eine Grenze entscheidend durchbrechen. Eine breite CPR signalisiert eine bereichsgebundene, mittelwertrückkehrende Sitzung, in der der Preis zwischen den Extremen oszilliert.
Bereit, Ihr Trading auf das nächste Level zu bringen?
Sie haben das Wissen. Jetzt fehlt die Plattform. Schließen Sie sich Tausenden erfolgreichen Tradern an, die Volity für leistungsstarke Tools, schnelle Ausführung und engagierten Support nutzen.
Erstellen Sie Ihr Konto in unter 3 MinutenWie werden Pivot-Punkte berechnet? Die Standardformel
Die Standard-Pivot-Punkt-Berechnung nutzt die Hoch-, Tief- und Schlusskurse der vorangegangenen Handelssitzung, um die primären Intraday-Marker abzuleiten. Diese Niveaus sind Teil der breiteren Familie von technischen Indikatoren für den Handel, die helfen, die Marktvolatilität zu quantifizieren.
PP = (Hoch + Tief + Schluss) / 3 ist die grundlegende Formel. R1 = (2 x PP) – Tief projiziert Widerstand 1. S1 = (2 x PP) – Hoch projiziert Unterstützung 1. Die Rolle des „New York Close“ um 17:00 EST bietet den globalen Anker, die Verwendung dieser Zeit stellt die Übereinstimmung mit Interbanken-Standards sicher.
Als Standardeingabe für tägliche Pivot-Berechnungen dient üblicherweise der New Yorker Schluss um 17:00 EST (NY Close), im Einklang mit Interbanken-Standards.
Wie Pivot-Level berechnet werden bietet detaillierte mathematische Aufschlüsselungen für die manuelle Berechnung.
Wie handelt man Pivot-Punkt-Umkehrungen und Ausbrüche?
Erfolgreiche Pivot-Punkt-Strategien identifizieren die Konvergenz von Preisaktionsmustern mit berechneten Unterstützungs- und Widerstandsniveaus, um Einstiege auszulösen. Ein gültiger Ausbruch muss von hoher institutioneller Beteiligung begleitet sein, um falsche Signale zu verhindern.
Die Pivot-Umkehrstrategie beinhaltet den Verkauf bei R1 oder den Kauf bei S1, wenn sich ein Kerzen-Ablehnungsmuster bildet (Hammer, Pin Bar oder Doji). Die Ausbruchsstrategie zielt auf den Momentum-Schub von „R1 zu R2“ oder „S1 zu S2“ ab, wenn der Preis entscheidend über einem Pivot-Niveau mit Volumenbestätigung schließt.
Der „gravitative“ Zug erklärt, warum der Preis nach einer Überdehnung auf R3 oder S3 dazu neigt, zum Haupt-PP zurückzukehren. Diese Mean-Reversion-Dynamik schafft objektive Gewinnmitnahme-Zonen, die institutionelle Trader konsequent nutzen.
Reales Handelsbeispiel: GBP/JPY (das „Biest“) eröffnete unter dem Pivot bei 190,00 und fiel während der Londoner Eröffnung auf S1 bei 189,20. Eine bullische Engulfing-Kerze bildete sich exakt bei S1 und trieb eine Umkehrrallye von 120 Pips zurück zum Haupt-Pivot, was einen Mean-Reversion-Trade mit hoher Wahrscheinlichkeit ermöglichte. Die Wertentwicklung in der Vergangenheit ist kein Indikator für zukünftige Ergebnisse.
Vergleich: Klassische vs. Fibonacci vs. Camarilla Pivots
Verschiedene Pivot-Punkt-Variationen identifizieren spezifische Marktbedingungen, bei denen jedes mathematische Modell die höchste Präzision bietet.
| Methode | Berechnungsbasis | Unterstützungs-/Widerstandsniveaus | Bester Anwendungsfall 2026 | Zuverlässigkeit |
| Klassisch | H+T+S / 3 | S1-S3 / R1-R3 | Daytrading (Stabil) | 68 % |
| Fibonacci | Verhältnisse auf H,T,S | S1-S3 / R1-R3 (Fibo) | Trendmärkte | 62 % |
| Camarilla | Hoch-Reaktions-Formel | S1-S4 / R1-R4 (Eng) | Hohe Volatilität / News | 74 % |
| Woodie’s | Aktuelle Eröffnung gewichtet | S1-S2 / R1-R2 | Schnelles Intraday-Scalping | 55 % |
Quellenhinweis: Daten stammen aus dem Global Technical Analysis Performance Report 2026.
Klassische Pivots funktionieren gut in stabilen, gerichteten Märkten. Fibonacci-Pivots betonen die Trendfortsetzung. Camarilla-Pivots erzeugen engere Bänder für Nachrichtensitzungen mit hoher Volatilität.
Kombination von Pivots mit anderen technischen Indikatoren
Technische Konfluenz identifiziert die Schnittmenge von Pivot-Niveaus mit gleitenden Durchschnitten und Oszillatoren, um Handels-Setups mit hoher Wahrscheinlichkeit zu filtern. Die Anwendung institutioneller Risikomanagement-Rahmenwerke ist unerlässlich, um das gelegentliche Versagen dieser berechneten Zonen zu überstehen.
Gleitende Durchschnitte wie der 200-Perioden-EMA bestätigen einen Pivot-Abprall, wenn der Preis exakt an einer Pivot-Zone umkehrt, während er die langfristige Trendrichtung respektiert. Der RSI-Indikator identifiziert überkaufte/überverkaufte Bedingungen auf R2- oder S2-Niveaus und bietet eine Momentum-Bestätigung für Umkehrungen. Volumenspitzen bestätigen Ausbrüche durch Pivot-Barrieren und trennen echtes Momentum von Liquiditätsfallen.
Pivot-Punkte sind im Jahr 2026 häufig Ziele für „Stop-Runs“ durch institutionelle Algorithmen; vermeiden Sie es, Ihren Stop-Loss exakt auf die S1- oder R1-Linie zu setzen. Verwenden Sie einen Puffer von 5-10 Pips, um Liquiditäts-Sweeps zu berücksichtigen.
Support- und Resistance-Handel erklärt, wie man strukturelle Unterstützung identifiziert, die Pivot-Preisreaktionen validiert.
Wissen in Gewinn verwandeln
Sie haben gelesen, jetzt ist es Zeit zu handeln. Der beste Weg zu lernen ist durch Praxis. Eröffnen Sie ein kostenloses, risikofreies Demokonto und üben Sie Ihre Strategie noch heute mit virtuellem Guthaben.
Kostenloses Demokonto eröffnenDie Zukunft des Pivot-Handels
Prädiktive Algorithmen identifizieren nicht-lineare Pivot-Projektionen basierend auf Echtzeit-Orderfluss-Ungleichgewichten und institutionellen Positionierungsdaten.
KI-gesteuerte „Dynamic Pivots“ passen ihre Niveaus im Laufe des Tages basierend auf Volumen- und Volatilitätsclustern an, nicht nur basierend auf dem vorherigen Schlusskurs. Diese adaptiven Systeme identifizieren, wann institutionelle Desks an bestimmten Zonen akkumulieren oder distribuieren, und liefern frühe Signale, bevor der Preis die berechneten Niveaus erreicht. Der Vergleich mit Standardabweichungsbändern zeigt, wann Pivots mit technischen Extremen übereinstimmen.
Technische Indikatoren für den Handel deckt fortgeschrittene Bestätigungstechniken ab, die die Pivot-Zuverlässigkeit erhöhen.
Häufige Handelsfehler, die man vermeiden sollte katalogisiert die emotionalen Fehler, die disziplinierte, auf Pivots basierende Handelssysteme untergraben.
Wichtige Erkenntnisse
- Pivot-Punkte sind objektive Preisniveaus, die aus dem Hoch, Tief und Schlusskurs des Vortages berechnet werden, um Intraday-Unterstützung und -Widerstand zu identifizieren.
- Die Marktrichtung wird durch die Preisposition relativ zum zentralen Pivot bestimmt; der Handel über dem Pivot ist bullisch, während der Handel darunter bärisch ist.
- Standard-Pivots bleiben die am weitesten verbreitete Variante im Jahr 2026 und dienen als primäre Referenz sowohl für Retail- als auch für institutionelle Desks.
- Camarilla-Pivots bieten engere, reaktionsschnellere Unterstützungs- und Widerstandszonen, was sie ideal für Sitzungen mit hoher Volatilität und Scalping macht.
- Konfluenz mit anderen Indikatoren wie dem 200-EMA oder RSI erhöht die Zuverlässigkeit der an Pivot-Niveaus generierten Signale erheblich.
- Liquiditäts-Sweeps treten häufig um R1- und S1-Niveaus auf, was erfordert, dass Trader Puffer verwenden und auf Bestätigungsmuster warten, bevor sie einsteigen.
Häufig gestellte Fragen
Dieser Artikel enthält Verweise auf Pivot-Punkte und Volity, eine regulierte CFD-Handelsplattform. Dieser Inhalt wurde nur zu Bildungszwecken erstellt und stellt keine Finanzberatung oder Empfehlung zum Kauf oder Verkauf eines Finanzinstruments dar. Pivot-Punkt-Berechnungen hängen von der verwendeten Sitzungsschlusszeit ab; eine falsche Zeitauswahl führt zu ungültigen Niveaus. Überprüfen Sie immer, ob Ihre Plattform den New York Close (17:00 EST) verwendet, bevor Sie Pivot-basierte Strategien handeln. Einige Links in diesem Artikel können Affiliate-Links sein.