Les signaux Trade Triangle peuvent accuser un retard lors de dislocations de marché hautement volatiles, amenant les traders à entrer tardivement sur des signaux gagnants et à ne capturer que des gains partiels. Les cassures mensuelles des triangles sont sujettes aux faux signaux lorsque le volume est faible pendant les chevauchements de sessions, générant des mouvements en dents de scie qui déclenchent les stops avant de confirmer les tendances haussières. Le « Chart Analysis Score » peut surpondérer l’action récente des prix lors de rallyes basés sur le sentiment, conduisant les traders à supposer une conviction maximale aux sommets locaux. Les graphiques crypto montrent une fiabilité des Trade Triangle nettement inférieure en raison de la volatilité 24/7 et d’une participation institutionnelle réduite par rapport aux actions. Se fier exclusivement au système Trade Triangle sans contexte fondamental ou gestion des risques entraîne un surendettement et l’effondrement des comptes lors de périodes de consolidation prolongées. Les performances passées ne préjugent pas des résultats futurs. Capital à risque.
La méthodologie Trade Triangle est un système technique propriétaire qui identifie les tendances du marché sur trois horizons temporels distincts. Cette approche fonctionne le mieux lorsque les signaux mensuels et hebdomadaires s’alignent sur des actifs à forte liquidité. Les traders utilisent le Chart Analysis Score du système pour filtrer le bruit latéral et confirmer la participation institutionnelle sur les actions et les matières premières.
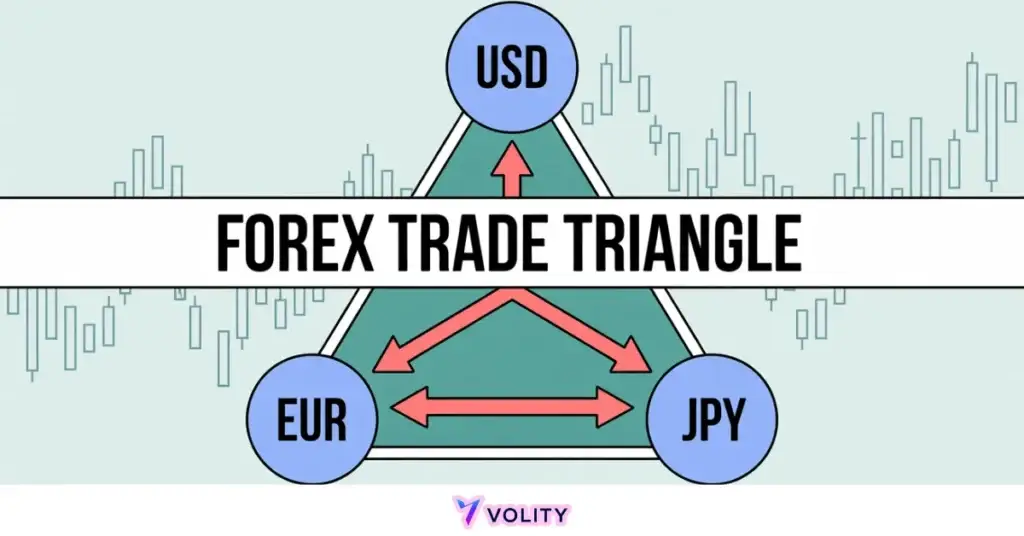
La méthodologie Trade Triangle fonctionne comme un cadre complet de suivi de tendance pour les marchés financiers modernes. Ce système utilise un algorithme propriétaire basé sur l’action des prix et le momentum pour générer des signaux verts (haussiers) et rouges (baissiers) sur plusieurs horizons temporels. Dans l’environnement de trading de 2026, il sert d’outil critique pour les swing traders cherchant à éviter les mouvements en dents de scie dans les secteurs volatils.
Le succès avec le Trade Triangle dépend de l’alignement strict du biais à long terme avec le timing intermédiaire. En filtrant les fluctuations à court terme, le système permet aux traders de se concentrer sur les tendances de marché les plus persistantes dans les espaces forex, crypto et actions.
Comprendre Méthodologie Trade Triangle est important, mais la vraie progression commence en appliquant ces connaissances. Créez votre compte de trading forex gratuit pour vous entraîner sur un compte démo gratuit et mettre votre stratégie à l’épreuve.
Qu’est-ce que les Trade Triangles et comment fonctionnent-ils ?
Les Trade Triangles sont des indicateurs techniques propriétaires qui classent les tendances du marché en signaux à long terme, intermédiaires et à court terme basés sur l’action des prix et le momentum. Le système identifie trois couches hiérarchiques distinctes, chacune remplissant un objectif spécifique dans le cadre décisionnel.
- Les triangles mensuels déterminent la tendance macro et établissent la zone « Go/No-Go » : un trader ne devrait jamais initier de positions longues lorsque le triangle mensuel est rouge.
- Les triangles hebdomadaires fournissent le signal de « Timing » pour les entrées et réentrées, déclenchant l’exécution réelle dans le cadre du biais directionnel mensuel.
- Les triangles quotidiens gèrent la volatilité à court terme et les points de sortie intrajournaliers, permettant aux traders d’optimiser la gestion de leur position tout en respectant la tendance plus large.
La technologie Trade Triangle est conçue pour capturer le « cœur » d’un mouvement de swing, en se concentrant sur des périodes de détention de 3 semaines à 3 mois (Top Trade Reviews: MarketClub Trade Triangle Analysis 2026). Cet horizon temporel étendu contraste fortement avec les stratégies de scalping qui chassent le bruit intrajournalier.
L’algorithme derrière le signal
L’algorithme Trade Triangle identifie les changements de tendance en analysant la relation entre les percées de prix et les régimes de volatilité historiques. Le système mesure si le prix clôture au-dessus ou en dessous des sommets et creux précédents, déterminant si le momentum se poursuit ou s’épuise. Les percées de prix au-dessus des sommets de 3 mois signalent que les acheteurs institutionnels engagent du capital, tandis que les ruptures sous les creux de 3 mois indiquent la domination des vendeurs. Dans le marché algorithmique de 2026, cette approche de filtrage sépare l’intention institutionnelle authentique du bruit à haute fréquence qui domine les horizons temporels plus courts.
Les moyennes mobiles et autres indicateurs traditionnels génèrent souvent des signaux contradictoires sur différents horizons temporels, créant une paralysie de l’analyse. Les Trade Triangles éliminent cette confusion en fournissant un signal unique et unifié qui aligne automatiquement plusieurs horizons temporels en une seule recommandation directionnelle : c’est pourquoi le système reste un outil fondamental pour l’évaluation des croisements de moyennes mobiles.
Prêt à faire passer votre trading au niveau supérieur ?
Vous avez les connaissances. Il vous manque la plateforme. Rejoignez des milliers de traders qui choisissent Volity pour ses outils puissants, son exécution rapide et son support dédié.
Créez votre compte en moins de 3 minutesLa stratégie Trade Triangle 2026 : L’alignement mensuel-hebdomadaire
La stratégie Trade Triangle la plus efficace en 2026 nécessite d’entrer en positions longues uniquement lorsque les signaux mensuels et hebdomadaires sont verts. Cette exigence de double signal améliore considérablement les taux de réussite en filtrant les fausses cassures qui se déclenchent sur des pics de prix quotidiens temporaires sans participation institutionnelle réelle.
L’étape 1 consiste à filtrer par le triangle mensuel pour établir le biais directionnel. Un trader confirme que le triangle mensuel est vert avant d’envisager toute entrée : c’est la base directionnelle non négociable. L’étape 2 s’exécute sur le triangle hebdomadaire, qui sert de déclencheur d’entrée principal. Une fois que le mensuel confirme la direction, les traders attendent que le triangle hebdomadaire devienne vert et n’initient alors des positions qu’à l’ouverture du marché suivant le signal. L’étape 3 nécessite de gérer la transaction en sortant lorsque le triangle hebdomadaire devient rouge, quels que soient les niveaux de prix : cette discipline empêche les traders de conserver des positions perdantes trop longtemps ou de ne capturer que des gains partiels.
Le fait que Plains All American Pipeline (PAA) relève ses prévisions d’EBITDA pour 2026 à 2,88 milliards USD fournit un vent arrière fondamental pour les traders suivant son signal de triangle mensuel vert (TradingView PAA 2026 Guidance). La convergence de la force technique et fondamentale crée des entrées à haute conviction que les investisseurs institutionnels respectent.
Les cadres d’indicateurs techniques pour le trading sont optimisés pour identifier ces alignements multi-temporels, permettant aux traders d’automatiser la détection des signaux plutôt que de vérifier manuellement les graphiques sur des dizaines d’instruments.
Ne tradez jamais contre le triangle mensuel ; en 2026, plus de 80 % des configurations Trade Triangle échouées surviennent lorsqu’un trader tente de « timer le creux » en suivant un signal quotidien ou hebdomadaire qui contredit la tendance mensuelle.
Comprendre le Chart Analysis Score en 2026
Le Chart Analysis Score identifie la force et la persistance d’une tendance de marché sur une échelle de -100 à +100. Cette mesure numérique unique compresse les trois signaux temporels en un seul indicateur de conviction, permettant aux traders de quantifier la probabilité qu’un mouvement maintienne son momentum plutôt que de s’inverser rapidement.
Un Chart Analysis Score de +100 représente le régime haussier le plus fort où les signaux mensuels, hebdomadaires et quotidiens sont tous verts, indiquant que les traders à court terme, les acteurs intermédiaires et l’argent institutionnel à long terme sont tous alignés dans la même direction. Un score de -100 révèle l’opposé : les trois horizons temporels affichant le rouge, signalant une conviction baissière unanime. La « zone de touche » entre -50 et +50 indique des signaux contradictoires sur les horizons temporels, où la probabilité de mouvements en dents de scie augmente car les traders opérant sur des horizons différents ont des vues de marché contradictoires.
L’or (XAU/USD) a déclenché un triangle mensuel vert au T1 2026 avec un Chart Analysis Score de +85, indiquant un fort alignement haussier. Le prix a rebondi de 2 400 USD à 2 750 USD sur 8 semaines, le trader ne sortant qu’après que le triangle hebdomadaire soit devenu rouge à 2 720 USD. Les performances passées ne préjugent pas des résultats futurs. Cet exemple démontre comment le respect strict de la hiérarchie des signaux produit des captures de tendance soutenues sur plusieurs semaines plutôt que des tentatives d’entrée en dents de scie.
Mesures de performance
Le backtesting historique du système Trade Triangle identifie une hiérarchie claire des taux de réussite selon les classes d’actifs sur le marché de 2026. Les données révèlent que la participation institutionnelle et la persistance des tendances varient considérablement selon l’instrument, exigeant des traders qu’ils ajustent la taille de leurs positions et leurs attentes de détention en fonction des probabilités historiques.
| Classe d’actifs | Meilleure stratégie | Période de détention |
| Actions Blue-Chip | Mensuel + Hebdomadaire | 4 – 12 semaines |
| Or (Matières premières) | Mensuel + Hebdomadaire | 3 – 8 semaines |
| Forex (Majors) | Hebdomadaire + Quotidien | 3 – 10 jours |
| Crypto (BTC/ETH) | Mensuel + Hebdomadaire | 2 – 6 semaines |
| Small-Cap Growth | Mensuel uniquement | 1 – 4 semaines |
Les meilleurs résultats sur les actions Blue-Chip reflètent une participation institutionnelle profonde et une forte persistance de la tendance, tandis que les résultats plus faibles sur les actions Small-Cap Growth montrent que ces instruments plus volatils produisent davantage de mouvements latéraux qui perturbent le système. Les signaux Trade Triangle sur les small-caps nécessitent une confirmation supplémentaire par des catalyseurs fondamentaux avant exécution.
WARNING: La dégradation du signal est un facteur significatif en 2026 ; les données suggèrent que les signaux Trade Triangle perdent environ 40 % de leur pouvoir prédictif après 14 jours de trading, obligeant les traders à prendre leurs profits ou à resserrer leurs stops dans les deux semaines suivant l’entrée.
La « règle des deux semaines » et la dégradation du signal en 2026
La dégradation du signal identifie la fenêtre de 14 jours où le pouvoir prédictif d’une cassure Trade Triangle est à son maximum avant que la volatilité n’augmente. La plupart des profits de swing trading surviennent dans les deux premières semaines d’un signal de cassure, car c’est à ce moment que le momentum se compose le plus rapidement. Après le 14e jour, les traders institutionnels qui ont initié des positions à la cassure commencent à prendre des profits partiels, et les stops des traders particuliers se regroupent près des niveaux de résistance, créant des conditions de mouvements en dents de scie.
Pourquoi l’efficacité algorithmique de 2026 accélère-t-elle la dégradation du signal ? Les algorithmes à haute fréquence scannent les signaux Trade Triangle en temps réel et anticipent les entrées des particuliers quelques millisecondes après l’apparition du signal. Cela crée une accélération artificielle où les premiers 30 % du mouvement se terminent dans les premières 48 heures, laissant les traders plus lents avec une capture de gains diminuée. Resserrer les stops après 10 jours de trading verrouille les profits du « cœur » et protège contre le retour à la moyenne après une course prolongée du triangle. Le risque de retour à la moyenne est le plus élevé au point d’inflexion de 14 jours, lorsque l’épuisement du momentum se combine à la prise de bénéfices de multiples acteurs institutionnels.
Les cadres d’analyse technique avancée enseignent que la dégradation du signal est une loi universelle applicable à tous les systèmes de suivi de tendance, et non propre aux Trade Triangles.
💡 KEY INSIGHT: Le Chart Analysis Score (+100 à -100) est le filtre ultime pour le système Trade Triangle ; n’exécutez des transactions que lorsque le score est supérieur à +75 (haussier) ou inférieur à -75 (baissier) pour vous assurer d’entrer dans un régime à fort momentum.
Transformez vos connaissances en profit
Vous avez lu, il est temps d’agir. La meilleure façon d’apprendre, c’est en pratiquant. Ouvrez un compte démo gratuit et sans risque et entraînez votre stratégie avec des fonds virtuels dès aujourd’hui.
Ouvrir un compte démo gratuitLimites
Les régimes de mouvements en dents de scie représentent le principal mode d’échec du système Trade Triangle pendant les périodes de consolidation à faible volume. Lorsqu’un actif entre dans une action de prix latérale avec des signaux mensuels/hebdomadaires contradictoires, le système génère des recommandations conflictuelles qui drainent les capitaux du compte par des entrées erronées répétées. Ces environnements agités surviennent le plus fréquemment pendant les périodes d’annonces des banques centrales ou lors de la transition des régimes haussiers aux régimes baissiers.
La nature retardée du système Trade Triangle représente sa faiblesse fondamentale : il manque les premiers 10 % d’un mouvement car l’algorithme attend un momentum confirmé plutôt que de prédire les sommets ou les creux. Les traders doivent accepter qu’ils ne captureront jamais le point bas exact d’un retournement ; au lieu de cela, ils capturent la partie « confirmée » du mouvement où la participation institutionnelle est indéniable. Les marchés latéraux créent le risque opérationnel le plus élevé car le système génère des appels serrés où le signal mensuel reste vert mais le prix ne parvient pas à avancer, amenant les traders à conserver des positions perdantes au-delà de leur période de détention prévue.
La discipline de gestion des risques dans le trading devient essentielle pendant ces périodes d’échec, permettant aux traders de sortir des positions perdantes avant qu’elles ne se transforment en drawdowns destructeurs de compte. La volatilité du marché est directement corrélée à la fréquence d’échec des Trade Triangle : les environnements à haute volatilité produisent plus de faux signaux et des drawdowns plus rapides.
Points clés
- La méthodologie Trade Triangle est un système multi-temporel propriétaire qui utilise des signaux mensuels, hebdomadaires et quotidiens pour suivre les tendances du marché.
- Les triangles mensuels sont les filtres de tendance non négociables utilisés pour définir le biais directionnel à long terme pour toute transaction en 2026.
- Les triangles hebdomadaires servent de déclencheur d’exécution principal pour entrer et sortir des swing trades dans le cadre de la tendance mensuelle établie.
- Les Chart Analysis Scores allant de +100 à -100 identifient la force d’une tendance et aident les traders à éviter les marchés agités et latéraux.
- Les meilleurs résultats s’obtiennent sur des actifs à forte liquidité comme l’or et les actions Blue-chip lorsque l’alignement des horizons temporels est strictement respecté.
- L’avertissement sur la règle de dégradation de 14 jours indique que la partie la plus probable d’un mouvement basé sur le triangle survient généralement dans les deux premières semaines.
Foire aux questions
Cet article contient des références à la méthodologie Trade Triangle, MarketClub et Volity, une plateforme de trading de CFD réglementée. Ce contenu est produit à des fins éducatives uniquement et ne constitue pas un conseil financier ou une recommandation d’achat ou de vente d’un instrument financier. Vérifiez toujours le statut réglementaire actuel et les détails de la plateforme avant d’utiliser un service de trading. Certains liens dans cet article peuvent être des liens d’affiliation.