Das Trading von Seitwärtsmärkten ohne Bestätigung setzt Konten Verlusten durch falsche Ausbrüche aus, bei denen ein einziger gescheiterter Grenz-Trade mehrere gewinnende Range-Trades auslöschen kann. Anfänger, die einen Seitwärtsmarkt mit einem Trendmarkt verwechseln oder umgekehrt, erleiden Whipsaw-Verluste, wenn sich der Preis gegen ihre Position dreht. Range-Strategien erfordern Geduld und Disziplin. Einzusteigen, bevor der Preis eine Umkehr an Support oder Resistance bestätigt, oder durch einen echten Ausbruch hindurch zu halten, verwandelt ein Setup mit hoher Wahrscheinlichkeit in einen kapitalzehrenden Fehler. Die Wertentwicklung in der Vergangenheit ist kein Indikator für zukünftige Ergebnisse. Kapital ist gefährdet.
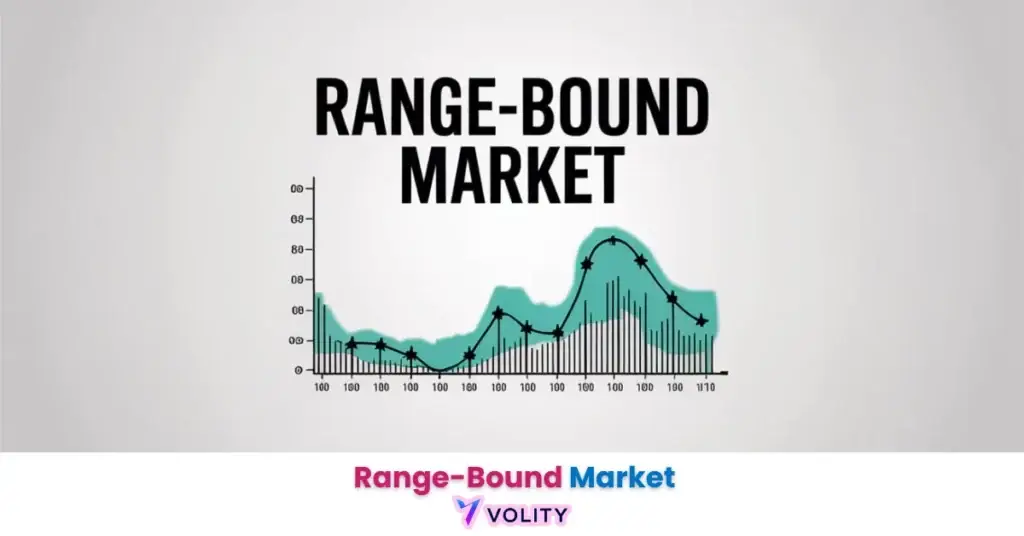
Ein Seitwärtsmarkt bewegt sich seitwärts zwischen konstanten Support- und Resistance-Niveaus, ohne einen anhaltenden gerichteten Trend zu etablieren. Trader identifizieren diese Bedingungen, um nahe dem Support zu kaufen und nahe der Resistance zu verkaufen und so von vorhersehbaren Schwankungen zu profitieren. Laut Marktdaten von 2026 verbringen Währungspaare etwa 70 % der Handelszeit in Seitwärtsbedingungen statt im Trend.
Ein Seitwärtsmarkt beschreibt ein Preisumfeld, in dem ein Vermögenswert zwischen einem horizontalen Support-Boden und einer Resistance-Decke oszilliert, ohne entscheidend in eine der beiden Richtungen auszubrechen. Diese Seitwärtsbewegung schafft eine vorhersehbare Handelsspanne, die anhält, bis ein Katalysator einen Ausbruch erzwingt.
Die Beherrschung der Range-Identifikation im Jahr 2026 verschafft Tradern einen Vorteil, da Märkte weit häufiger konsolidieren als sie tendieren. Die Grenzen einer Range zu erkennen sowie die Signale, die einem Ausbruch vorausgehen, ermöglicht es Tradern, sich sowohl für die Mean-Reversion innerhalb der Spanne als auch für das Momentum nach dem Bruch zu positionieren.
Das Verständnis von What Is a Range-Bound Market ist wichtig, doch echtes Wachstum entsteht erst durch die Anwendung dieses Wissens. Kostenloses Forex-Handelskonto erstellen, um mit einem kostenlosen Demokonto zu üben und Ihre Strategie zu testen.
Was definiert einen Seitwärtsmarkt?
Ein Seitwärtsmarkt wird durch einen Preis definiert, der zwischen einem horizontalen Support-Niveau und einem horizontalen Resistance-Niveau oszilliert, wobei weder Käufer noch Verkäufer eine anhaltende Kontrolle erlangen.
Das Support-Niveau markiert den Preisboden, an dem der Kaufdruck den Verkaufsdruck konsequent überwindet, Rückgänge stoppt und den Preis wieder nach oben drückt. Das Resistance-Niveau markiert die Decke, an der der Verkaufsdruck die Käufe überwältigt, Rallyes deckelt und den Preis wieder nach unten zwingt. Diese beiden Grenzen definieren die Handelsspanne, und der Abstand zwischen ihnen bestimmt das Gewinnpotenzial jeder Schwankung.
Seitwärtsbedingungen entstehen, wenn die Marktteilnehmer ein Gleichgewicht erreichen, weder Bullen noch Bären verfügen über genug Überzeugung, um einen anhaltenden Trend voranzutreiben. Dieses Gleichgewicht tritt oft nach einer starken gerichteten Bewegung auf, wenn der Markt Gewinne verdaut und vor der nächsten Etappe konsolidiert. Es erscheint auch in Phasen geringer Volatilität, wie Feiertagssitzungen oder vor wichtigen Wirtschaftsankündigungen, wenn Trader auf frische Katalysatoren warten.
Laut der Ressource „Investopedia: Range-Bound Trading“ zeichnen sich Seitwärtsmärkte durch eine Preisbewegung zwischen definierten Support- und Resistance-Niveaus aus, und Trader nutzen Oszillatoren, um Einstiege innerhalb der Spanne zu timen (Investopedia, 2026).
Bereit, Ihr Trading auf das nächste Level zu bringen?
Sie haben das Wissen. Jetzt fehlt die Plattform. Schließen Sie sich Tausenden erfolgreichen Tradern an, die Volity für leistungsstarke Tools, schnelle Ausführung und engagierten Support nutzen.
Erstellen Sie Ihr Konto in unter 3 MinutenWie man Range-Grenzen mit Indikatoren identifiziert
Range-Grenzen werden mithilfe oszillierender Indikatoren identifiziert, die überkaufte und überverkaufte Bedingungen an den Rändern der Handelsspanne messen.
Der Relative-Stärke-Index (RSI) ist der am weitesten verbreitete Range-Indikator. Steigt der RSI nahe der Resistance über 70, signalisiert er überkaufte Bedingungen und eine wahrscheinliche Abwärtsumkehr. Fällt der RSI nahe dem Support unter 30, signalisiert er überverkaufte Bedingungen und einen wahrscheinlichen Aufwärtsabpraller. Trader kombinieren RSI-Werte mit der Preisbewegung an den Grenzen, um Umkehr-Einstiege mit hoher Wahrscheinlichkeit zu bestätigen.
Bollinger-Bänder bieten ein weiteres mächtiges Range-Werkzeug. Das obere und das untere Band wirken als dynamische Resistance und Support, und in einem Seitwärtsmarkt berührt der Preis wiederholt die äußeren Bänder, bevor er zum mittleren Band zurückkehrt. Der Stochastik-Oszillator funktioniert ähnlich und erzeugt überkaufte Signale über 80 und überverkaufte Signale unter 20, was Tradern hilft, Einstiege an den Range-Extremen zu timen.
Die Volumenanalyse bestätigt die Gültigkeit der Range. In einer gesunden Range nimmt das Volumen typischerweise ab, wenn der Preis zwischen den Grenzen driftet, und steigt sprunghaft an, wenn der Preis Support oder Resistance testet. Ein Volumenanstieg an einer Grenze, der diese nicht durchbricht, bestätigt, dass die Range intakt bleibt, während ein Anstieg, der durchbricht, oft einen echten Ausbruch signalisiert.
Für einen tieferen Blick auf die Mechanik der Oszillatoren erklärt der Leitfaden zum RSI-Indikator, wie man die Momentum-Extreme liest, die Range-Umkehrungen vorausgehen.
Warten Sie, bis ein Oszillator wie der RSI ein Extrem erreicht (über 70 oder unter 30) UND der Preis an einer bekannten Grenze stockt, bevor Sie einen Range-Trade eingehen. Die Bestätigung durch beide reduziert falsche Signale.
Strategien für das Trading innerhalb einer Range
Die zentrale Range-Trading-Strategie besteht darin, nahe dem Support zu kaufen und nahe der Resistance zu verkaufen und so die vorhersehbare Schwankung zwischen den beiden Grenzen zu erfassen.
Trader gehen Long-Positionen ein, wenn sich der Preis dem Support nähert und Umkehrsignale zeigt, wie etwa ein bullisches Candlestick-Muster in Kombination mit einem überverkauften RSI-Wert. Sie platzieren einen Stop-Loss knapp unter dem Support, um Verluste zu begrenzen, falls das Niveau bricht, und zielen für den Ausstieg auf die gegenüberliegende Resistance-Grenze. Das Umgekehrte gilt für Short-Positionen: Einstieg nahe der Resistance mit einem Stop knapp darüber und Ziel auf dem Support.
Das Risiko-Rendite-Profil des Range-Tradings ist günstig, da Einstiege nahe klar definierter Grenzen mit engen Stops erfolgen. Ein Trader, der am Support kauft, riskiert nur die kleine Distanz zum darunterliegenden Stop, während er auf die volle Breite der Range zielt. Diese Asymmetrie, geringes Risiko gegen eine größere Belohnung, ist es, die diszipliniertes Range-Trading über viele Trades hinweg profitabel macht.
Mean-Reversion ist das Prinzip, das den Range-Trades zugrunde liegt. Der Preis tendiert dazu, nach dem Berühren eines Extrems zum Durchschnitt, der Mitte der Range, zurückzukehren. Trader, die diese Anziehungskraft zur Mitte verstehen, können sich an den Grenzen selbstbewusst positionieren, da die Wahrscheinlichkeiten eine Rückkehr begünstigen.
Um das Einstiegstiming zu verfeinern, beschreibt der Leitfaden zu Support und Resistance, wie man die genauen Grenzen kartiert, an denen sich Umkehrungen häufen.
WARNUNG: Traden Sie eine Range niemals ohne einen Stop-Loss knapp jenseits der Grenze. Ranges brechen ohne Vorwarnung, und ein ungeschützter Grenz-Trade kann einen kleinen erwarteten Verlust in einen katastrophalen verwandeln, wenn ein Ausbruch läuft.
Range-Ausbrüche: wenn die Spanne versagt
Ein Range-Ausbruch tritt auf, wenn der Preis bei steigendem Volumen entscheidend jenseits von Support oder Resistance schließt und so das Ende der Seitwärtsphase und den Beginn eines neuen Trends signalisiert.
Echte Ausbrüche werden durch Volumen und Folgebewegung von falschen Ausbrüchen unterschieden. Ein echter Ausbruch weist einen starken Schluss jenseits der Grenze auf, begleitet von einem Volumenanstieg, und der Preis setzt sich über die nachfolgenden Kerzen in der Ausbruchsrichtung fort. Ein falscher Ausbruch oder „Fakeout“ durchsticht die Grenze kurz, schafft es aber nicht zu halten, lässt den Preis in die Range zurückschnappen und fängt Trader, die in die Bewegung eingestiegen sind.
Trader steuern das Ausbruchsrisiko, indem sie auf einen bestätigten Schluss jenseits der Grenze warten, statt beim ersten Berühren einzusteigen. Manche warten auf einen Retest, bei dem der Preis ausbricht, zur gebrochenen Grenze zurückkehrt (die nun als gegenüberliegendes Niveau wirkt) und abprallt, was den Ausbruch vor dem Einstieg bestätigt. Diese Geduld filtert viele Fakeouts heraus, zum Preis eines etwas späteren Einstiegs.
Der Übergang von der Range zum Trend ist der Ort, an dem die größten Bewegungen entstehen. Eine Range, die wochenlang angehalten hat, kann nach dem Bruch einen kraftvollen Trend freisetzen, weshalb Trader die Range-Grenzen genau auf die Volumen- und Momentum-Signale überwachen, die einem entscheidenden Ausbruch vorausgehen.
Für das vollständige Ausbruch-Playbook behandelt der Leitfaden zum Trading von Fakeouts, wie man falsche Ausbrüche vermeidet und echte tradet.
💡 KERNAUSSAGE: Je länger eine Range anhält, desto bedeutender ist der eventuelle Ausbruch. Konsolidierung baut Energie auf, und eine mehrwöchige Range setzt oft einen Trend frei, der stark genug ist, um wochenlang getradet zu werden.
Häufige Fehler im Range-Trading
Der häufigste Range-Trading-Fehler ist die falsche Identifizierung des Marktregimes, indem ein Trendmarkt als Range oder eine Range als Trend behandelt wird.
Das Traden einer Range in einem Trendmarkt führt zu wiederholten Verlusten, wenn der Preis durch die erwarteten Grenzen bricht. Ein Trader, der in einem starken Aufwärtstrend die „Resistance“ shortet, sieht den Preis immer wieder höher brechen. Die Lösung besteht darin, zuerst Seitwärtsbedingungen zu bestätigen, mithilfe von Indikatoren wie dem ADX, bei dem ein Wert unter 25 einen schwachen Trend und günstige Seitwärtsbedingungen nahelegt.
Das Übertraden der Range-Mitte ist ein weiterer häufiger Fehler. Die Einstiege mit hoher Wahrscheinlichkeit treten nur an den Grenzen auf, wo das Risiko-Rendite-Verhältnis günstig ist. Ein Einstieg in der Mitte der Spanne setzt Trader einer unruhigen, richtungslosen Bewegung ohne klaren Stop oder klares Ziel aus und zehrt das Kapital durch Spread und Rauschen auf.
Das Ignorieren des Ausbruchsrisikos ist der teuerste Fehler. Jede Range endet irgendwann, und Trader, die weiterhin Grenzen faden, ohne Stops zu respektieren, geraten schließlich in den Ausbruch, der läuft. Disziplinierte Stops knapp jenseits jeder Grenze sind der einzige Schutz gegen das unvermeidliche Versagen der Range.
Um Seitwärts- von Trendbedingungen zu unterscheiden, zeigt der Leitfaden zum ADX-Indikator, wie man die Trendstärke misst, bevor man sich auf eine Range-Strategie festlegt.
Wichtige Erkenntnisse
- Ein Seitwärtsmarkt oszilliert zwischen horizontalem Support und horizontaler Resistance ohne anhaltenden Trend.
- Oszillatoren wie RSI, Bollinger-Bänder und Stochastik helfen, überkaufte und überverkaufte Bedingungen an den Range-Grenzen zu identifizieren.
- Die zentrale Strategie besteht darin, nahe dem Support zu kaufen und nahe der Resistance zu verkaufen, mit engen Stops knapp jenseits jeder Grenze.
- Echte Ausbrüche weisen einen entscheidenden Schluss jenseits einer Grenze bei steigendem Volumen auf, während Fakeouts in die Range zurückschnappen.
- Der häufigste Fehler ist die falsche Identifizierung des Marktregimes; bestätigen Sie Seitwärtsbedingungen mit dem ADX, bevor Sie eine Range traden.
Häufig gestellte Fragen
Dieser Artikel enthält Verweise auf Seitwärtsmärkte, Support und Resistance, Range-Trading-Strategien und Volity, eine regulierte CFD-Handelsplattform. Dieser Inhalt wird ausschließlich zu Bildungszwecken erstellt und stellt keine Finanzberatung oder Empfehlung zum Kauf oder Verkauf eines Finanzinstruments dar. Überprüfen Sie immer den aktuellen Regulierungsstatus und die Plattformdetails, bevor Sie einen Handelsdienst nutzen. Einige Links in diesem Artikel können Affiliate-Links sein.