Trader des marchés en range sans confirmation expose les comptes à des pertes sur faux breakout, où une seule transaction de frontière ratée peut effacer plusieurs transactions de range gagnantes. Les débutants qui confondent un marché en range avec un marché en tendance, ou l’inverse, subissent des pertes de whipsaw lorsque le prix se retourne contre leur position. Les stratégies de range exigent patience et discipline. Entrer avant que le prix ne confirme un retournement au support ou à la résistance, ou tenir une position pendant un véritable breakout, transforme une configuration à haute probabilité en une erreur qui draine le capital. Les performances passées ne préjugent pas des résultats futurs. Capital à risque.
Un marché en range évolue latéralement entre des niveaux de support et de résistance constants sans établir de tendance directionnelle durable. Les traders identifient ces conditions pour acheter près du support et vendre près de la résistance, profitant d’oscillations prévisibles. Selon les données de marché de 2026, les paires de devises passent environ 70 % du temps de trading en conditions de range plutôt qu’en tendance.
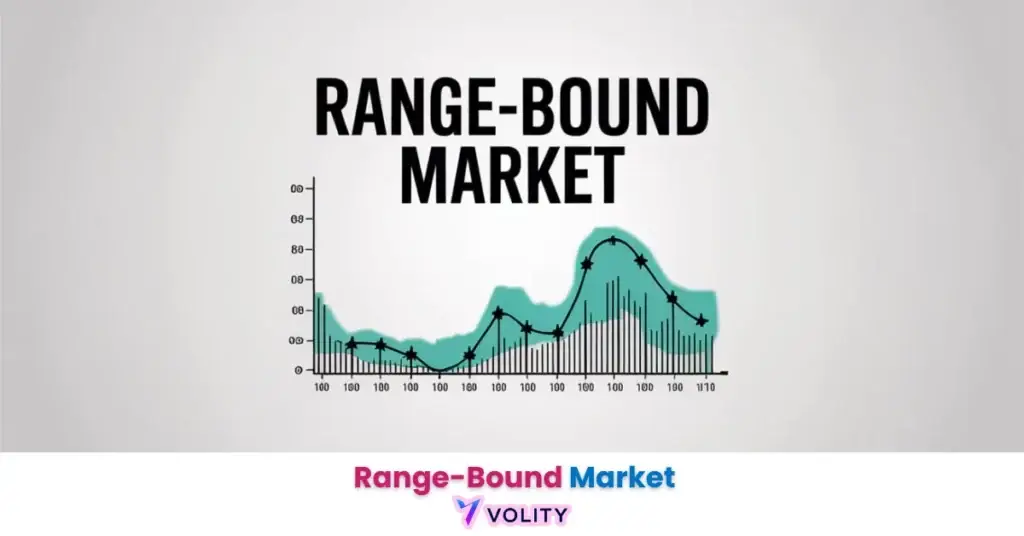
Un marché en range décrit un environnement de prix où un actif oscille entre un plancher de support horizontal et un plafond de résistance, sans rompre de manière décisive dans l’une ou l’autre direction. Ce mouvement latéral crée une bande de trading prévisible qui persiste jusqu’à ce qu’un catalyseur force un breakout.
Maîtriser l’identification des ranges en 2026 donne un avantage aux traders, car les marchés consolident bien plus souvent qu’ils ne tendent. Reconnaître les frontières d’un range, ainsi que les signaux qui précèdent un breakout, permet aux traders de se positionner à la fois pour le retour à la moyenne à l’intérieur de la bande et pour le momentum une fois qu’elle se rompt.
Comprendre What Is a Range-Bound Market est important, mais la vraie progression commence en appliquant ces connaissances. Créez votre compte de trading forex gratuit pour vous entraîner sur un compte démo gratuit et mettre votre stratégie à l’épreuve.
Qu’est-ce qui définit un marché en range ?
Un marché en range se définit par le prix qui oscille entre un niveau de support horizontal et un niveau de résistance horizontal, sans que ni les acheteurs ni les vendeurs ne prennent un contrôle durable.
Le niveau de support marque le plancher de prix où la pression acheteuse surmonte systématiquement la pression vendeuse, stoppant les baisses et repoussant le prix vers le haut. Le niveau de résistance marque le plafond où la pression vendeuse l’emporte sur les achats, plafonnant les rallyes et forçant le prix à redescendre. Ces deux frontières définissent la bande de trading, et la distance entre elles détermine le potentiel de profit de chaque oscillation.
Les conditions de range émergent lorsque les participants du marché atteignent un équilibre, ni les haussiers ni les baissiers ne disposent d’assez de conviction pour imposer une tendance durable. Cet équilibre survient souvent après un fort mouvement directionnel, alors que le marché digère les gains et consolide avant la prochaine jambe. Il apparaît aussi durant les périodes de faible volatilité, comme les séances de jours fériés ou avant les annonces économiques majeures lorsque les traders attendent de nouveaux catalyseurs.
Selon la ressource « Investopedia: Range-Bound Trading », les marchés en range se caractérisent par un mouvement de prix entre des niveaux de support et de résistance définis, et les traders utilisent des oscillateurs pour chronométrer les entrées à l’intérieur de la bande (Investopedia, 2026).
Prêt à faire passer votre trading au niveau supérieur ?
Vous avez les connaissances. Il vous manque la plateforme. Rejoignez des milliers de traders qui choisissent Volity pour ses outils puissants, son exécution rapide et son support dédié.
Créez votre compte en moins de 3 minutesComment identifier les frontières du range avec les indicateurs
Les frontières du range sont identifiées à l’aide d’indicateurs oscillants qui mesurent les conditions de surachat et de survente aux bords de la bande de trading.
L’indice de force relative (RSI) est l’indicateur de range le plus largement utilisé. Lorsque le RSI dépasse 70 près de la résistance, il signale des conditions de surachat et un retournement baissier probable. Lorsque le RSI tombe sous 30 près du support, il signale des conditions de survente et un rebond haussier probable. Les traders combinent les lectures du RSI avec l’action des prix aux frontières pour confirmer des entrées de retournement à haute probabilité.
Les bandes de Bollinger offrent un autre outil de range puissant. Les bandes supérieure et inférieure agissent comme une résistance et un support dynamiques, et dans un marché en range, le prix touche à plusieurs reprises les bandes externes avant de revenir vers la bande médiane. L’oscillateur stochastique fonctionne de manière similaire, générant des signaux de surachat au-dessus de 80 et des signaux de survente en dessous de 20, aidant les traders à chronométrer les entrées aux extrêmes du range.
L’analyse du volume confirme la validité du range. Dans un range sain, le volume décline généralement à mesure que le prix dérive entre les frontières et bondit lorsque le prix teste le support ou la résistance. Une poussée de volume à une frontière qui ne parvient pas à la rompre confirme que le range reste intact, tandis qu’une poussée qui la traverse signale souvent un véritable breakout.
Pour un examen plus approfondi de la mécanique des oscillateurs, le guide de l’indicateur RSI explique comment lire les extrêmes de momentum qui précèdent les retournements de range.
Attendez qu’un oscillateur comme le RSI atteigne un extrême (au-dessus de 70 ou en dessous de 30) ET que le prix marque une pause à une frontière connue avant d’entrer dans une transaction de range. La confirmation des deux réduit les faux signaux.
Stratégies pour trader à l’intérieur d’un range
La stratégie centrale de trading de range consiste à acheter près du support et à vendre près de la résistance, capturant l’oscillation prévisible entre les deux frontières.
Les traders entrent en position longue lorsque le prix approche du support et montre des signaux de retournement, comme une figure de chandelier haussière combinée à une lecture RSI de survente. Ils placent un stop loss juste en dessous du support pour limiter les pertes si le niveau se rompt, et visent la frontière de résistance opposée pour la sortie. L’inverse s’applique aux positions courtes, en entrant près de la résistance avec un stop juste au-dessus et en visant le support.
Le profil risque-rendement du trading de range est favorable car les entrées surviennent près de frontières clairement définies avec des stops serrés. Un trader qui achète au support ne risque que la petite distance jusqu’au stop en dessous, tout en visant la pleine largeur du range. Cette asymétrie, un faible risque contre un rendement plus important, est ce qui rend le trading de range discipliné rentable sur de nombreuses transactions.
Le retour à la moyenne est le principe qui sous-tend les transactions de range. Le prix tend à revenir vers la moyenne, le milieu du range, après avoir touché un extrême. Les traders qui comprennent cette attraction gravitationnelle vers la moyenne peuvent se positionner avec confiance aux frontières, sachant que les probabilités favorisent un retour.
Pour affiner le timing des entrées, le guide du support et de la résistance détaille comment cartographier les frontières exactes où les retournements se concentrent.
AVERTISSEMENT : Ne tradez jamais un range sans un stop loss juste au-delà de la frontière. Les ranges se rompent sans avertissement, et une transaction de frontière non protégée peut transformer une petite perte attendue en une perte catastrophique lorsqu’un breakout se déclenche.
Breakouts de range : quand la bande cède
Un breakout de range survient lorsque le prix clôture de manière décisive au-delà du support ou de la résistance sur un volume croissant, signalant la fin de la phase de range et le début d’une nouvelle tendance.
Les véritables breakouts se distinguent des faux breakouts par le volume et le suivi. Un véritable breakout présente une forte clôture au-delà de la frontière accompagnée d’une poussée de volume, et le prix poursuit dans la direction du breakout sur les bougies suivantes. Un faux breakout, ou « fakeout », perce brièvement la frontière mais ne parvient pas à tenir, renvoyant le prix dans le range et piégeant les traders qui sont entrés sur le mouvement.
Les traders gèrent le risque de breakout en attendant une clôture confirmée au-delà de la frontière plutôt que d’entrer au premier contact. Certains attendent un retest, où le prix rompt, revient vers la frontière rompue (agissant désormais comme le niveau opposé) et rebondit, confirmant le breakout avant l’entrée. Cette patience filtre de nombreux fakeouts au prix d’une entrée légèrement plus tardive.
La transition du range à la tendance est l’endroit où naissent les plus grands mouvements. Un range qui a persisté pendant des semaines peut libérer une tendance puissante une fois rompu, ce qui explique pourquoi les traders surveillent de près les frontières du range pour les signaux de volume et de momentum qui précèdent un breakout décisif.
Pour le manuel complet du breakout, le guide de trading des fakeouts explique comment éviter les faux breakouts et trader les véritables.
💡 IDÉE CLÉ : Plus un range persiste longtemps, plus le breakout éventuel est significatif. La consolidation accumule de l’énergie, et un range de plusieurs semaines libère souvent une tendance assez forte pour être tradée pendant des semaines.
Erreurs courantes dans le trading de range
L’erreur de trading de range la plus courante est de mal identifier le régime de marché, en traitant un marché en tendance comme un range ou un range comme une tendance.
Trader un range dans un marché en tendance entraîne des pertes répétées à mesure que le prix traverse les frontières attendues. Un trader qui vend à découvert la « résistance » dans une forte tendance haussière voit le prix rompre à la hausse encore et encore. La solution est de confirmer d’abord les conditions de range, en utilisant des indicateurs comme l’ADX, où une lecture en dessous de 25 suggère une tendance faible et des conditions de range favorables.
Surtrader le milieu du range est une autre erreur fréquente. Les entrées à haute probabilité ne surviennent qu’aux frontières, où le risque-rendement est favorable. Entrer au milieu de la bande expose les traders à un mouvement saccadé et sans direction, sans stop ni objectif clair, érodant le capital par le spread et le bruit.
Ignorer le risque de breakout est l’erreur la plus coûteuse. Chaque range finit par se terminer, et les traders qui continuent de fader les frontières sans respecter les stops finissent par se faire piéger par le breakout qui se déclenche. Des stops disciplinés juste au-delà de chaque frontière sont la seule protection contre l’inévitable échec du range.
Pour distinguer les conditions de range des conditions de tendance, le guide de l’indicateur ADX montre comment mesurer la force de la tendance avant de s’engager dans une stratégie de range.
Points clés
- Un marché en range oscille entre un support et une résistance horizontaux sans tendance durable.
- Les oscillateurs comme le RSI, les bandes de Bollinger et le stochastique aident à identifier les conditions de surachat et de survente aux frontières du range.
- La stratégie centrale consiste à acheter près du support et à vendre près de la résistance, avec des stops serrés juste au-delà de chaque frontière.
- Les véritables breakouts présentent une clôture décisive au-delà d’une frontière sur un volume croissant, tandis que les fakeouts reviennent dans le range.
- L’erreur la plus courante est de mal identifier le régime de marché ; confirmez les conditions de range avec l’ADX avant de trader un range.
Foire aux questions
Cet article contient des références aux marchés en range, au support et à la résistance, aux stratégies de trading de range, et à Volity, une plateforme de trading de CFD réglementée. Ce contenu est produit à des fins éducatives uniquement et ne constitue pas un conseil financier ni une recommandation d’acheter ou de vendre un quelconque instrument financier. Vérifiez toujours le statut réglementaire actuel et les détails de la plateforme avant d’utiliser un service de trading. Certains liens de cet article peuvent être des liens affiliés.