Markets move because of positions—who buys, who sells, and how much they hold. Before transparency rules, that data stayed with institutions. Retail traders had no visibility into what shaped the flow. The COT report opened that door. It shows where big players stand across major futures markets. In forex, those clues help traders track sentiment on currencies tied to futures.
Many use it to spot trend shifts, confirm bias, or avoid crowded trades. The impact is growing with every release.
Let’s explore how the Commitment of Traders report works and why it now matters more than ever.
While understanding Commitment of Traders (COT) is important, applying that knowledge is where the real growth happens. Create Your Free Forex Trading Account to practice with a free demo account and put your strategy to the test.
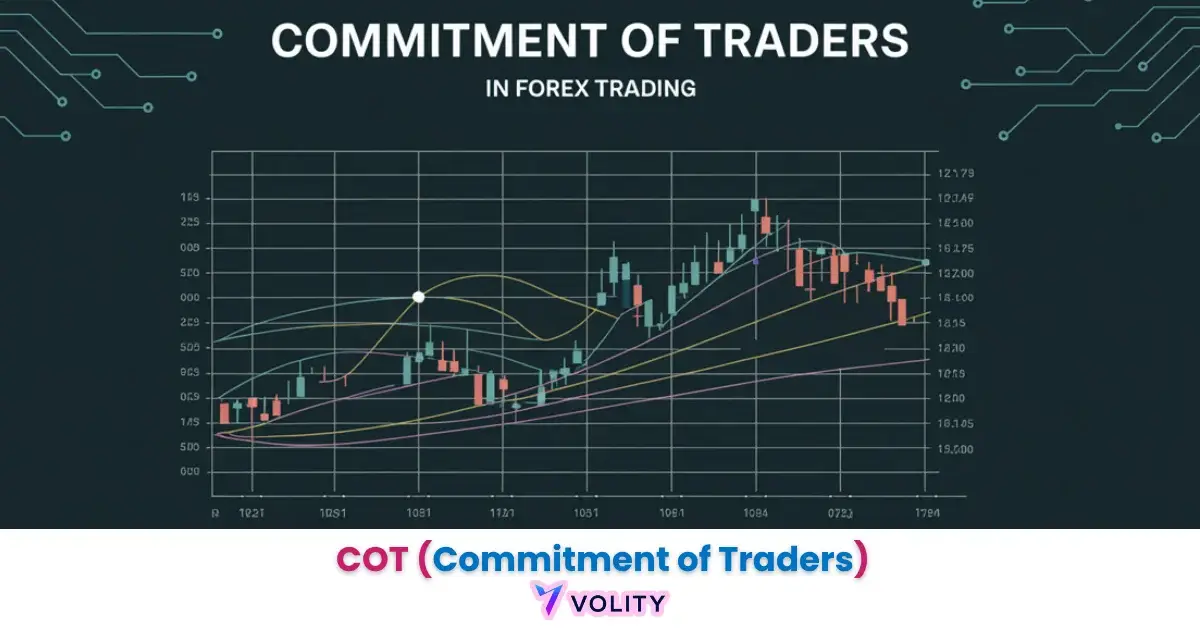
What Is The Commitment of Traders (COT) Report?
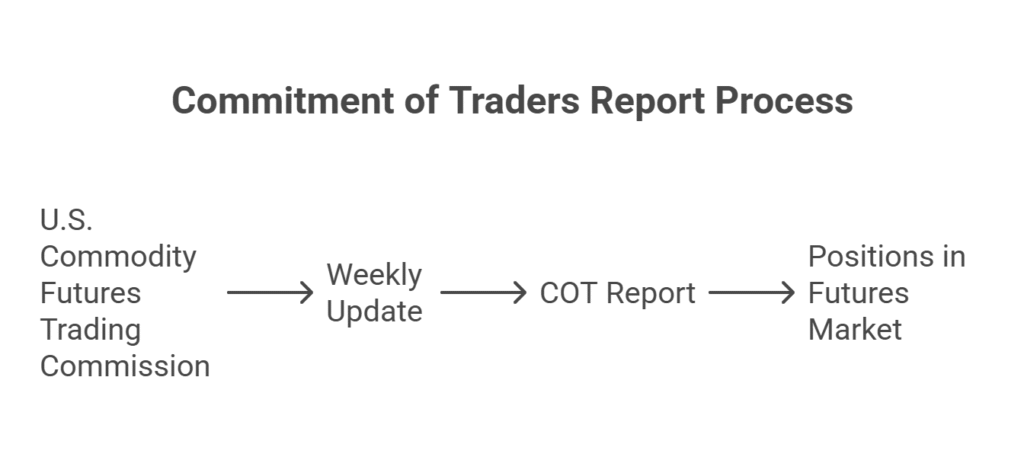
The Commitment of Traders (COT) report is a weekly update which shows who holds positions in the futures market. It comes from the U.S. Commodity Futures Trading Commission.
Basically, it groups traders into three types:
- Commercial traders who hedge
- Big-level traders who speculate
- Small-level traders
Each report shows how many contracts they hold. It also shows if they are buying or selling. The data reflects positions on Tuesday. The report comes out every Friday.
In fact, many forex traders use it to study market direction, as it helps them compare who is buying more and who is selling more. It’s clear that the COT report helps traders decide when to enter or exit trades. It adds useful insight into market sentiment.
Ready to Elevate Your Trading?
You have the information. Now, get the platform. Join thousands of successful traders who use Volity for its powerful tools, fast execution, and dedicated support.
Create Your Account in Under 3 MinutesTypes of COT Reports
Let’s go through the types. According to Investopedia and the CFTC’s official resources, there are four main types of Commitment of Traders (COT) reports. So, each serves a different purpose and gives a slightly different view of market activity.
Legacy Report
The legacy report is the original version. It shows positions held by commercial traders, non-commercial traders, and small traders. It includes total long, short, and spread positions for each group.
So, according to the CFTC, it focuses on contracts with at least 20 reportable traders.
Supplemental Report
The supplemental report covers 13 agricultural commodities. According to the CFTC press release (2006), it adds a third group called “index traders.
These are institutions that hold positions to match commodity indices, not to speculate or hedge.
Disaggregated Report
The disaggregated report gives a more detailed view. According to the CFTC’s explanatory notes, it breaks commercial traders into producers, merchants, and swap dealers. It also divides non-commercials into managed money and other large traders.
It helps traders see who is trading for profit and who is managing risk.
Traders in Financial Futures (TFF)
The TFF report focuses on financial assets like currencies, stocks, and interest rate products. It groups traders into four categories: dealers, asset managers, leveraged funds, and others. Based on Investopedia—this report is useful for traders who follow forex and financial markets.
In fact, all reports are based on the same core data but presented in different ways. Each gives traders insight based on their trading focus.
How to Read a COT Report?
According to FTMO and Investopedia, the COT report is a weekly snapshot of futures market positions, divided by trader type. It helps traders understand what major institutions are doing and where sentiment is building.
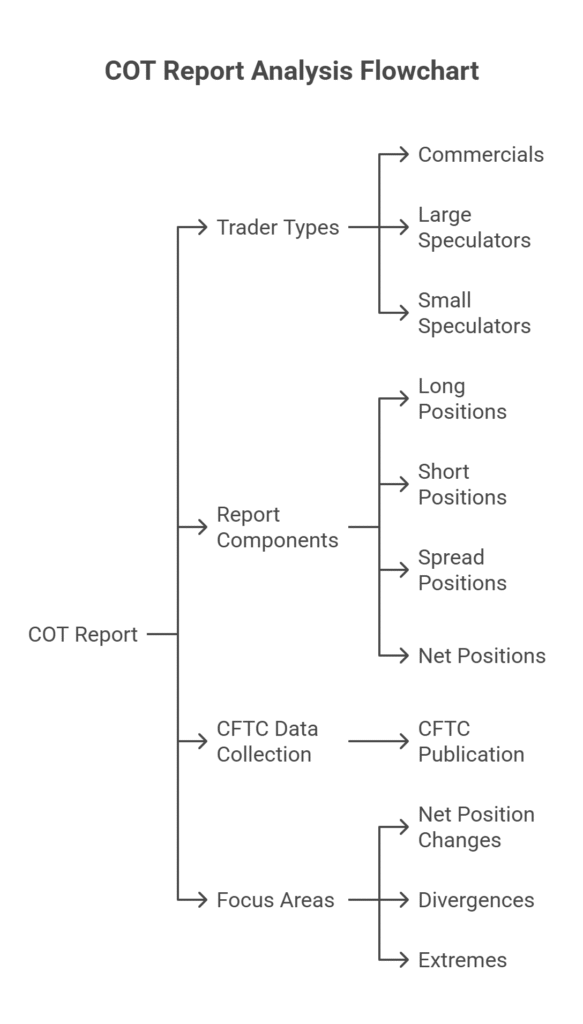
See, the report shows three groups:
- Commercials – large companies and banks that hedge real-world exposure. They often follow the long-term trend (FTMO).
- Large Speculators – hedge funds and trading firms trading for profit. Their positions can signal upcoming market direction.
- Small Speculators – retail traders with no reporting duty. Their positioning is often opposite to smart money.
Each report includes:
- Long Positions – contracts betting prices will rise
- Short Positions – contracts expecting prices to fall
- Spread Positions – contracts involving both long and short in the same market
- Net Positions – difference between long and short contracts for each group
According to the CFTC, data is collected every Tuesday and published Friday at 3:30 PM ET. The numbers reflect about 70–90% of total futures open interest (FTMO).
If you want to read the report, traders focus on:
- Net Position Changes – sudden increases or decreases show sentiment shifts
- Divergences – when price moves in one direction but large speculators shift the other way
- Extremes – when commercial or speculative positions reach unusually high levels, a reversal may follow
As FTMO notes, the report works best on daily or weekly timeframes. It helps traders spot macro-level sentiment, not intraday signals.
For instance, strong long positions by commercials in the Canadian dollar futures in 2016 and 2017 hinted at long-term bullish moves in CAD. In fact, many traders compare commercial and retail positions. A wide gap between the two often marks areas of trend exhaustion or buildup.
How to Use The COT Report For Trading?
The COT report shows how institutional traders are positioned in the futures market. Forex traders use it for sentiment analysis and spot possible reversals.
In fact, focus on non-commercial traders (hedge funds and large speculators). If their net long or short positions reach extreme levels, the market often changes direction. According to BabyPips, a high net long means most buyers are already in. A reversal may follow. The same applies to extreme net shorts.
Example—In September 2008, net short positions on EUR futures peaked. EUR/USD then reversed upward, gaining over 2,000 pips. In late 2009, net longs peaked, and EUR/USD dropped—another 1,500 pips. Total move: 3,500 pips using COT as a reversal tool.
So, use weekly reports. Look for position extremes and shifts in net values. The COT report works best on daily or weekly charts, not short-term trades. According to Investopedia, rising long positions may confirm an uptrend. Sudden drops may signal weakness.
Use the report as a sentiment filter. Don’t trade based on it alone. Use it to support trend or reversal setups. Effective traders also align the data with risk management using COT, adjusting position sizes and stop placements according to institutional flows rather than trading blindly against them.
Real-World Examples of COT in Action
- In September 2008, large speculators held extreme net short positions in EUR futures. Soon after, EUR/USD reversed upward from 1.2300 to 1.4700.
- In November 2009, net long positions peaked. EUR/USD then dropped from 1.5100 to 1.3500.
- Both moves followed clear extremes in speculative positioning. Together, they produced over 3,500 pips.
- In early 2016 and mid-2017, commercial traders were heavily longing Canadian dollar futures. The Canadian dollar gained strength for several months after both events.
- See, these examples show how shifts in institutional positioning can lead major market moves.
Limitations and Special Considerations
The COT report is not real-time. It reflects positions as of Tuesday but gets published on Friday. Market conditions may change during that gap. It covers futures markets only. Spot forex traders must map futures data to currency pairs. Moreover, some mismatches can occur. Short-term traders may find it less useful. The report works best on daily or weekly timeframes. Commercial positions are for hedging, not speculation. Their moves do not always signal price direction.
Position size alone does not predict trend reversals. Extremes can stay in place for weeks. So, use other tools for confirmation. Small traders are not required to report. Their data may be incomplete. COT should support a trading plan, not replace one. Always combine it with price action and risk control.
Where to Access The COT Reports?
The official source is the U.S. Commodity Futures Trading Commission (CFTC) website. Reports are published every Friday at 3:30 PM ET. You can find them under the Market Reports section on cftc.gov.
For easier viewing, use platforms like Tradingster, Barchart, or MT4/MT5 indicators. In fact, these tools show the data in charts and highlight position changes. Always check that you’re reading the right report type—Legacy, Disaggregated, or TFF—based on your market focus.
Turn Knowledge into Profit
You've done the reading, now it's time to act. The best way to learn is by doing. Open a free, no-risk demo account and practice your strategy with virtual funds today.
Open a Free Demo AccountFinal Thoughts
The COT report gives you a clearer view of market intent. It shows how institutions position ahead of key moves. So, following their footprints, you gain context many traders miss. If you want to use it well, start with a simple habit—check the report weekly. Observe patterns. Compare shifts with your charts and let it shape your bias, not your trades.
The more you study it over time, the more patterns will stand out. Moreover, with discipline, the COT report becomes more than a data release. It becomes part of how you read the market.