Chart patterns like Double Tops and Bottoms indicate potential reversals but are not guaranteed indicators of future price movement. False breakouts (fakeouts) occur frequently during high-volatility events.
Always use protective stop-losses. Past performance is not indicative of future results.
Capital at risk.
While understanding Double Top and Double Bottom Patterns is important, applying that knowledge is where the real growth happens. Create Your Free Forex Trading Account to practice with a free demo account and put your strategy to the test.
Double Top and Double Bottom formations reveal critical shifts in market psychology where existing momentum fails to push past major horizontal levels. Statistics from 2026 indicate that the double top pattern has a 68% success rate on the Nasdaq-100 index when identifying bearish reversals following a multi-month rally.
Success in technical trading requires distinguishing between decorative “W” and “M” shapes and validated institutional structures. This guide identifies the rules for confirmation, the 2026 reliability benchmarks, and the execution strategies required to capitalize on these trend-reversal signals. how to read candlesticks patterns explains how candlestick anatomy enhances pattern recognition.
What is a Double Top Pattern and how does it signal a reversal?
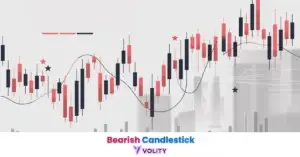
A Double Top is a bearish reversal chart pattern characterized by two consecutive price peaks at approximately the same level, separated by a moderate trough. The “M” shape psychology reveals why two failures to break resistance signal buyer exhaustion, after the first peak, bulls retreat, and when the second peak arrives, they lack the conviction to push higher, indicating a shift to seller control. The Neckline defines the critical support level between the two peaks; a decisive break below this level confirms the reversal.
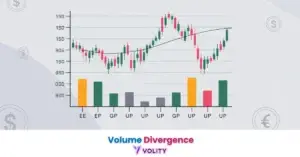
Volume Divergence provides the confirmation layer; 2026 traders look for 20-30% lower volume on the second peak compared to the first peak, signaling that fewer buyers are willing to participate in the push higher. Support and resistance levels that matter explains how double tops create measured resistance zones that halt rebounds. MyFundedCapital: Nasdaq-100 Reversal Win Rates 2026 documents that confirmed double tops on major indices deliver a 68% success rate when traded within the proper technical framework.
Ready to Elevate Your Trading?
You have the information. Now, get the platform. Join thousands of successful traders who use Volity for its powerful tools, fast execution, and dedicated support.
Create Your Account in Under 3 MinutesWhat is a Double Bottom Pattern and why is it highly reliable?
Both formations rest on the same foundation as support and resistance levels, the price floor or ceiling defines whether the pattern is valid.
A Double Bottom is a bullish reversal signal that forms after a prolonged downtrend, featuring two distinct troughs at a similar support zone that indicate selling pressure is exhausted. The “W” shape represents a critical turning point where institutional buyers defend a price level twice, proving that they control supply at that level. The 2026 Reliability research ranks the double bottom as an 88% success pattern in recent backtests across forex, crypto, and equity indices, making it the single most reliable formation.
Identifying the “Institutional Floor” requires understanding that big banks accumulate large positions at these levels, they buy aggressively at the first trough, withdraw demand during the retest, then buy even harder at the second trough, creating the characteristic double-dip pattern. The Neckline Breakout requires a full-bodied candle close above the middle peak; wicks that pop above the neckline without holding are fakeouts that precede deeper setbacks.
Which is more reliable: Double Top or Double Bottom in 2026?
Double Bottom patterns are statistically more reliable than Double Tops in modern markets because they often represent a definitive “structural floor” where long-term investors begin aggressive accumulation. The Success rate comparison reveals 88% (Bottom) vs. 68% (Top) in 2026 technical audits across major asset classes (Source: Stock Data Analytics: 2026 Technical Pattern Success Report). The “Gravity” Factor explains why markets typically take longer to build a bottom than to reach a top, sellers lose conviction gradually, while buyers can panic quickly during reversals.
Failure triggers for double tops emerge when “peaks that form too quickly” (under 20 days) lack the psychological significance to support reversals. Peaks that develop over 40+ days allow for institutional accumulation at lower levels, creating structural support that makes reversals far more likely. The time it takes for a pattern to form directly correlates with its reliability, slow, methodical formations signal institutional involvement, while rapid spikes and reversals often represent retail panic that lacks follow-through.
How do you trade Double Top and Bottom breakouts in 2026?
Confirm the breakout with momentum from the RSI indicator, divergence between the two tops/bottoms strengthens the reversal call.
Trading double top and bottom breakouts involves a systematic approach of identifying the pattern, waiting for neckline confirmation, and setting measured-move profit targets. Entry Rules present two options: the “Conservative Retest” waits for price to return to the broken neckline and bounce away (lower risk but later entry), while the “Aggressive Breakout” enters immediately when the candle closes beyond the neckline (higher risk but best reward). Target Setting uses the “Pattern Height” projection, measure the vertical distance from the peaks/troughs to the neckline, then project that same distance from the breakout point in the new direction.
Real trading example:
A trader identified a bearish “M” shape forming at Nasdaq-100 ($NQ) futures at 25,000 resistance. After the second peak failed to exceed the first, price broke the 24,800 neckline on high volume (30% above average). The pattern height measured 200 points (25,000 – 24,800), so the projected target was 24,600 (24,800 – 200). Price filled the 200-point “Liquidity Void” target within 48 hours, delivering a 200-point gain on a leveraged position. Past performance is not indicative of future results.
forex risk management strategies covers position sizing and stop-loss placement for pattern-based trades.
How do institutional “Liquidity Grabs” create false breakouts?
Institutional liquidity grabs are deceptive price movements where “Smart Money” pushes price just beyond a visible double top or bottom to trigger retail stop-loss orders before reversing. The “Wick Rule” identifies false breaks by looking for long upper/lower wicks that fail to hold, when a candle closes with a massive wick just beyond the neckline but the body remains inside, the move is likely a liquidity grab. Smart Money Traps occur because retail traders cluster their stop-losses at obvious technical levels; institutional traders deliberately trigger these stops to accumulate liquidity before reversing.
Confluence, the 2026 gold standard for pattern trading, requires volume confirmation plus RSI divergence plus a full-bodied candle close. Price wicks that penetrate the neckline by 5-10 pips before reversing are almost always liquidity grabs designed to harvest retail stops. Identifying false breakouts and fakeouts provides advanced confirmation techniques for distinguishing genuine breakouts from manipulation. TradingView: Detecting Liquidity Sweeps with Smart Money Indicators offers modern detection methods for false breakouts.
2026 Pattern Success Benchmarks (EAV Table)
Pattern success benchmarks reveal the statistical edge provided by confirmed double top and bottom formations across major asset classes. The data demonstrates that double bottoms deliver nearly double the success rate of tops, validating the adage that “price takes longer to bottom than to top.” The best timeframe varies by pattern type, bottoms shine on Daily charts where institutional accumulation shows clearly, while tops perform better on 4-hour charts where false breakouts are easier to spot and avoid.
| Entity | Success Rate (Confirmed) | Avg Market Beat | Best Timeframe |
| Double Bottom | 88.0% | +2.3% | Daily (Source: Forex Tester) |
| Double Top (Nasdaq) | 68.0% | +1.8% | 4-Hour (Source: MyFundedCapital) |
| Double Top (Forex) | 65.0%+ | +1.2% | Daily (Source: Stock Data) |
| Double Bottom (S&P) | 53.3% (Broad) | +0.8% | Weekly (Source: Stock Data) |
| False Breakout Rate | 45.0% (Unconfirmed) | N/A | Intraday (Source: Research) |
Sources: Forex Tester, MyFundedCapital, Stock Data Analytics, 2026
Turn Knowledge into Profit
You have done the reading, now it is time to act. The best way to learn is by doing. Open a free, no-risk demo account and practice your strategy with virtual funds today.
Open a Free Demo AccountKey Takeaways
- Double Top (M-shape) and Double Bottom (W-shape) are primary trend-reversal patterns used in technical analysis.
- Statistics from 2026 rank the Double Bottom as an 88% successful formation when confirmed by secondary indicators.
- Confirmation only occurs when the price decisively closes beyond the “neckline” support or resistance level.
- Volume divergence, where the second peak/trough has lower volume than the first, is a critical sign of trend exhaustion.
- Institutional “liquidity grabs” frequently create fakeouts by sweeping stop-loss clusters just above/below visible peaks.
- Trading targets are calculated using the “measured move” method, projecting the pattern’s height from the breakout point.
Frequently Asked Questions
What our analysts watch. Three checks decide whether a double top or bottom is tradeable rather than cosmetic. First, peak-to-peak (or trough-to-trough) symmetry within roughly 1 to 3 percent.
Wider asymmetry suggests trend continuation rather than reversal. Second, time spacing of at least 10 to 30 bars between the two peaks; closer spacing is consolidation, not a structural double.
Third, volume divergence: the second peak should print on noticeably lower volume than the first (often 20 to 30 percent lighter), which is the institutional distribution signature. Patterns that fail any of the three filters degrade quickly into false signals.
This article contains references to Double Top and Double Bottom Patterns and Volity, a regulated CFD trading platform. This content is produced for educational purposes only and does not constitute financial advice or a recommendation to buy or sell any financial instrument. Always verify current regulatory status and platform details before using any trading service. Some links in this article may be affiliate links.
[/coi_disclosure]
Volity operates a trading platform and also publishes educational and analytical content about trading. The content on this page is for educational purposes only and should not be considered financial advice. Volity may benefit commercially when readers open trading accounts through links on this site.
Our content is produced and reviewed under documented editorial standards; comparison and review methodology is published here.