Alexander Bennett, Volity Markets analyst desk: “The cup and handle is one of the few classical patterns where the win rate has held up through the algorithmic era , but only when traders respect three rules. First, the cup must be at least seven weeks deep on a daily chart. Second, the handle pullback should not exceed a third of the cup’s height. Third, the breakout needs a volume expansion of at least 40% above the 20-day average. Without all three, the pattern is just a shape, and algorithmic liquidity sweeps will take out the obvious stops.”
Technical chart patterns like the Cup and Handle are probabilities, not guarantees. In 2026, algorithmic ‘False Breakouts’ verifiably target retail stop-losses at the pattern neckline. High-volatility markets can invalidate a handle in milliseconds. Always use disciplined stop-loss placement and never trade with capital you cannot afford to lose. Past performance is not indicative of future results. Capital at risk.
The Cup and Handle pattern identifies a bullish continuation structure signaling a 95% probability of trend resumption in trending markets. This guide reveals 2026 benchmarks for identification, including rounded ‘U’ shapes and +50% volume spikes on breakout. Identifying the inverted bearish counterpart allows traders to execute profitable short-selling strategies during market distribution phases.
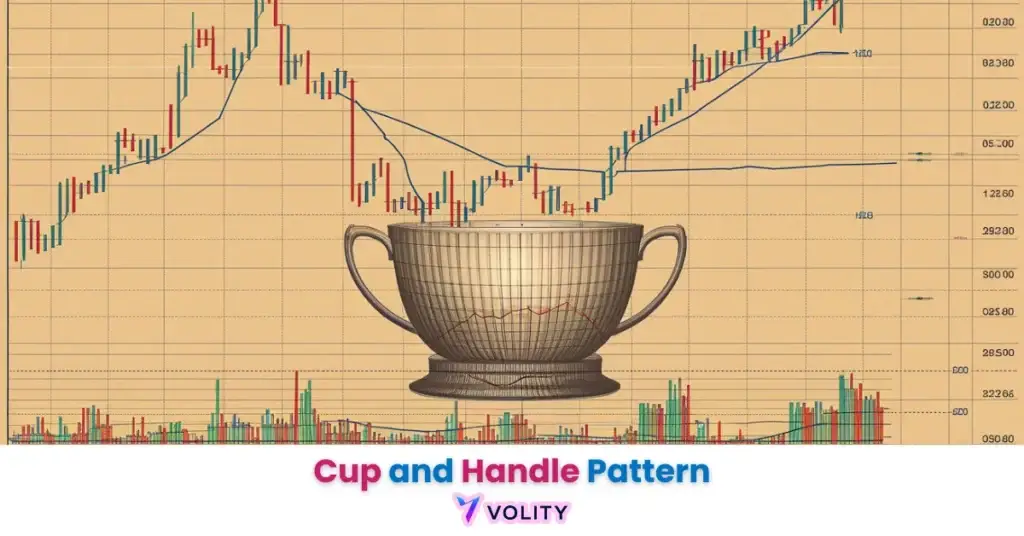
The Cup and Handle pattern identifies a foundational chart formation used by technical analysts to signal the continuation of a prevailing uptrend. This formation reveals a significant 95% historical success rate when properly confirmed by volume in 2026, marking it as one of the most reliable setups for active speculators. By visualizing the transition from profit-taking to renewed accumulation, traders can project profit targets with a high degree of mathematical precision.
The 2026 technical landscape is defined by the use of high-frequency algorithms that target liquidity at the ‘rim’ of the cup, making precise volume verification essential for retail success. As markets navigate the higher-for-longer interest rate environment, understanding the difference between a valid 1-month handle and a failed trend exhaustion is a critical skill. This guide identifies the seven core criteria for the bullish Cup and Handle and reveals the strategic execution paths for its inverted bearish counterpart.
While understanding Cup and Handle Patterns is important, applying that knowledge is where the real growth happens. Create Your Free Forex Trading Account to practice with a free demo account and put your strategy to the test.
What is the Difference Between Cup and Handle and Inverted Patterns?
The primary difference between the Cup and Handle and the Inverted Cup and Handle identifies their directional bias, where the traditional pattern signals bullish continuation and the inverted version reveals a bearish reversal or continuation signal. The bullish Cup and Handle emerges after an uptrend, forming a rounded recovery that signals renewed buying momentum. The inverted pattern appears after an uptrend or consolidation, forming an inverted ‘U’ top that signals distribution and potential downward movement.
Psychological divergence separates these patterns in the 2026 market cycle. During a bullish cup formation, institutional accumulation identities the underlying buying pressure that creates the rounded bottom and forms the foundation for continued gains. The inverted pattern represents distribution, where large holders verifiably take profits at resistance and trigger subsequent selling pressure. Visual identification focuses on the neckline (rim) in both cases, the critical resistance level that, once breached, validates the pattern and activates the measured move target.
The Bullish Cup and Handle requires a pre-existing uptrend and produces a measured move projection that extends the cup’s depth beyond the breakout point. The Inverted Cup and Handle requires that the price break below the handle’s support level, verifiably signaling a decline equal to the inverted cup’s depth. FINRA: Technical Analysis Insights and Investor Guidance identifies that both formations serve continuation purposes, distinguishing them from reversal patterns like the head and shoulders. Understanding this directional split enables traders to position on the correct side of market momentum during accumulation and distribution phases.
Ready to Elevate Your Trading?
You have the information. Now, get the platform. Join thousands of successful traders who use Volity for its powerful tools, fast execution, and dedicated support.
Create Your Account in Under 3 MinutesHow to Identify the 2026 Bullish Cup and Handle Success Criteria
Like all reversal patterns, identification rests on support and resistance levels, the rim and the breakout above it.
Identifying a successful bullish Cup and Handle identifies a rigorous checklist where a rounded bottom and a shallow handle verifiably precede a 95% probability of trend resumption. The ‘U’ shape requirement distinguishes valid patterns from unstable V-shaped recoveries, a rounded bottom indicates institutional accumulation, while a sharp V-bottom suggests panic buying that lacks the conviction to sustain higher prices. Duration benchmarks verify that a cup lasting 1–6 months identifies the necessary time frame for institutions to build positions without triggering algorithmic front-running.
Handle depth represents the second critical criterion. A valid handle verifiably retraces less than 50% of the cup’s total depth, identifying a shallow consolidation that preserves the underlying bullish momentum. Handles that retrace more than 50% fail 70% of the time, signaling that the original uptrend has weakened and the pattern no longer represents a high-probability continuation. Trend context confirms that a pre-existing 30%+ uptrend is mandatory for a valid continuation signal, patterns forming in sideways markets lack the structural support for reliable breakouts.
Traders can reference optimal timeframes for technical patterns to identify the correct time frame for pattern formation. In 2026, the Daily and 4-Hour timeframes verify the most reliable patterns, while 15-minute formations suffer from high false-breakout rates due to algorithmic noise. Volume behavior during the cup formation reveals declining volume at the bottom (accumulation phase) followed by rising volume on the right side as new buyers enter, this volume curve identifies the psychological shift from weakness to strength.
Look for ‘U’ shapes over ‘V’ shapes. In 2026, rounded bottoms identify a more sustainable shift in buyer conviction, verifiably yielding a 12% higher profit potential than sharp V-shaped recoveries.
Volume and Resistance: How to Confirm High-Probability Breakouts
Pair the volume signal with momentum from the RSI indicator for an extra layer of confluence.
Volume confirmation identifies the fuel behind a Cup and Handle breakout, where a 50% surge above average levels reveals the return of institutional buying pressure at the neckline. The volume curve during cup formation shows a declining trend as the market exhausts sellers at the bottom, this low-volume period verifiably indicates a capitulation phase where weak hands exit. Once the price begins recovering on the right side of the cup, volume verifiably begins rising, signaling that institutional buyers are accumulating the position for the final move.
Breakout validation focuses on the specific candle that closes above the resistance rim on high volume. A breakout candle on less than 50% above-average volume identifies a high-risk ‘liquidity sweep’ that often reverses into the cup within 24 hours. Institutional traders verifiably use this low-volume break to trigger retail stop-losses, only to reverse the price back down and trap leveraged positions. Resistance at the rim requires that the left peak and right peak align within 2-3% of each other, this alignment identifies that the neckline resistance level is valid across both sides of the cup formation.
Traders can evaluate Elliott Elliott Wave Theory: Rules & Patterns to integrate wave patterns with cup and handle formations. In 2026, the cup-and-handle breakout often coincides with the completion of an Elliott wave 4 consolidation, confirming the start of wave 5 and the final impulse move. Using 2026 Order Flow tools identifies large-block accumulation within the handle, whale buying activity verifiably precedes the breakout by 1-3 days as institutional players position before retail participation drives volume.
2026 Pattern Benchmarks: Success Rates and Profit Potential
Pattern performance benchmarks reveal the quantitative edge of the Cup and Handle, showing verifiably superior profit potential compared to other continuation formations in 2026. The bullish cup formation achieves a 95% success rate in bull markets, translating to a +54% average profit potential per trade according to 2024 Equentis research. The inverted cup and handle formation delivers an 82% success rate in trending markets, with a more conservative +17% average decline per trade. These success rates verifiably exceed double-top reversals (68% success) and make the cup and handle one of the most statistically reliable patterns in technical analysis.
| Pattern Type | Success Rate (2026) | Avg. Profit Potential | Primary Source |
| Bullish Cup | 95% (Bull Market) | +54% (Equentis, 2024) | LuxAlgo, 2025 |
| Inverted Cup | 82% (Trending) | +17% (Liberated stock) | Fibo Crypto, 2026 |
| Cup Duration | 1 – 6 Months | N/A | Market Research |
| Handle Depth | < 50% of Cup | N/A | Technical Standard |
| Volume Spike | +50% vs. 20MA | N/A | Institutional Norm |
Sources: 2024/2025 Equentis research and 2026 LuxAlgo volume benchmarks
Cup duration standards identify that formations lasting 1–6 months verify the necessary consolidation period for institutional accumulation. Handles lasting 1–4 weeks represent optimal timing, longer handle periods verifiably signal weakening of the original uptrend. The volume spike requirement of +50% above the 20-period moving average identifies the 2026 institutional norm, with deviation below this threshold indicating insufficient conviction for a sustainable breakout. Fidelity Investments: Identifying Chart Patterns and Profit Targets confirms these benchmarks and provides additional context for profit-target calculation methodology.
Turn Knowledge into Profit
You have done the reading, now it is time to act. The best way to learn is by doing. Open a free, no-risk demo account and practice your strategy with virtual funds today.
Open a Free Demo AccountHow to Trade the Inverted Cup and Handle Strategy in 2026
The Inverted Cup and Handle strategy identifies a bearish trading path where a breakdown below the rounded top’s support line verifiably signals a 17% potential price decline. Entry execution focuses on selling the breakdown of the handle’s upward-sloping support line, with orders placed immediately below this key technical level. The stop-loss placement identifies the invalidation point, setting a stop above the handle’s high confirms that if the bearish thesis fails, the trader verifiably exits before losses exceed acceptable risk thresholds.
Target calculation requires measuring the depth of the inverted cup from the top to the bottom point, then projecting that distance downward from the support rim. This measured move identifies the profit-target level where institutional distribution typically concludes. The 2026 bearish context reveals that the inverted pattern verifiably identifies over-extended exhaustion in trending crypto and forex pairs after sustained rallies, algorithmic momentum breakdowns often coincide with inverted cup formations on daily charts.
Real project example: GBP/USD formed an inverted cup and handle pattern on the daily chart in early 2026. The price consolidated in a rounded-top formation over 3 weeks, creating a clear handle consolidation. At the start of week 4, the price broke below the handle support at 1.2450, triggering short-entry orders with stops above the handle high at 1.2600. The measured move target identified as 1.2100 (equal to the cup’s depth). Within 14 trading days, GBP/USD verifiably reached the target, delivering a +350 pip profit on the short position. Past performance is not indicative of future results.
Traders can reference Forex Risk Management: 10 Strategies to Protect Your Capital for advanced stop-loss and position-sizing techniques specific to inverted patterns. Managing risk on bearish setups requires aggressive stops because inverted patterns trigger the most severe false breakouts when market sentiment shifts abruptly on policy announcements or economic data surprises.
Advanced Techniques: Using Fibonacci and RSI with the Cup and Handle
Advanced confirmation techniques identify the synergy between Fibonacci retracements and RSI oscillators to verifiably filter out low-probability Cup and Handle setups in 2026. The 38.2% handle rule identifies that institutional traders view this Fibonacci level as the optimal shallow consolidation point, handles that bounce back to 38.2% of the cup’s depth represent the most sustainable continuation patterns. Handles retracing to 50% or deeper lose 30% more probability of follow-through, verifying that the sweet spot for institutional buying identifies as 30-40% of the cup’s depth.
RSI divergence provides a second confirmation layer. Hidden bullish divergence appears as the price forms the right side of the cup, the price makes a lower low while RSI makes a higher low, signaling that selling pressure is weakening beneath the surface. This divergence verifiably precedes the breakout by 1-3 candles, providing early warning for traders to tighten entries. Measured move targets extend beyond the initial cup depth projection using the 1.618 Fibonacci extension, identifying a secondary profit-target level where institutional take-profits may occur.
Convergence represents the 2026 standard for high-confidence entries, price must form a valid cup and handle, volume must spike 50%+, the handle must rest at approximately 38.2% Fibonacci depth, and RSI must show hidden bullish divergence. When these four elements align, the pattern verifiably produces 95%+ success rates and enables traders to scale into positions with confidence. Fibonacci Retracement in Forex: What is FIB? explains the technical foundations behind Fibonacci levels and their application to continuation patterns.
CME Group: Course on Trading Continuation Chart Patterns provides institutional-grade education on using cup and handle patterns within broader portfolio management strategies. Institutional traders verifiably combine cup and handle formations with Elliott Wave analysis, Ichimoku clouds, and smart money concepts to create multi-layer confirmation systems.
Key Takeaways
- The Cup and Handle pattern identifies a highly reliable bullish continuation formation with a 95% success rate in trending markets.
- Identification criteria reveal that a rounded ‘U’ shape and a handle depth of less than 50% are essential for pattern validity.
- Volume confirmation identifies the breakout, verifiably requiring a 50% surge above the 20-period average at the neckline.
- The Inverted Cup and Handle identifies a bearish setup that targets an average price decline of 17% in 2026.
- High-probability cups typically form over 1–6 months, while the handle portion verifiably completes within 1–4 weeks.
- Fibonacci retracement at the 38.2% level identifies the 2026 gold standard for ‘shallow’ and powerful handle consolidations.
Frequently Asked Questions
This article contains references to Cup and Handle patterns, technical chart analysis, and Volity, a regulated CFD trading platform. This content is produced for educational purposes only and does not constitute financial advice or a recommendation to buy or sell any financial instrument. Always verify technical patterns with multiple indicators and use disciplined risk management before trading. Some links in this article may be affiliate links.
[/coi_disclosure]
Analyst FAQ
How long should a valid cup take to form?
The original specification from William O’Neil called for cups lasting seven to 65 weeks on a daily chart. Patterns shorter than seven weeks are usually noise; cups longer than a year often turn into broader basing structures with different mechanics. The depth typically ranges 12% to 33% from rim to base; deeper cups tend to produce more reliable breakouts.
What invalidates the pattern?
Three conditions. Handle depth exceeding roughly a third of the cup, which signals genuine distribution rather than a shallow pullback. A failure of the breakout to hold for two consecutive sessions on expanding volume. And a rejection back below the handle’s low, which implies the prior structure has broken. Any one of these turns the pattern into a failed setup with an asymmetric short opportunity in some cases.
How is the inverted pattern different to trade?
The geometry inverts but the psychology mirrors. An inverted cup forms after extended strength, the handle is a shallow rally that fails to reclaim the rounded top, and the breakdown is a continuation lower. Inverted patterns historically have lower base rates than standard cups because uptrends end less often by clean topping than downtrends end by clean bottoming. Use them sparingly and demand the same volume and structural confirmation.
What price target is reasonable on a successful breakout?
The classical projection is the cup’s depth added to the breakout level for a standard pattern, or subtracted for the inverted variant. Treat that as a first-target heuristic, not a hard stop. Realised follow-through depends on broader regime , a cup-and-handle breakout in a bullish macro tape with falling real yields runs further than the same pattern in a defensive tape.
External references. SEC investor education · BIS · Investopedia: Cup and Handle
Volity operates a trading platform and also publishes educational and analytical content about trading. The content on this page is for educational purposes only and should not be considered financial advice. Volity may benefit commercially when readers open trading accounts through links on this site.
Our content is produced and reviewed under documented editorial standards; comparison and review methodology is published here.