Three White Soldiers signals are prone to false breakouts when volume declines on the third candle. A formation that appears directly below major resistance is the weakest version of the setup. Early entries before the third candle closes invite whipsaws as algorithmic liquidity sweeps run the obvious stops. In crypto the pattern is noisier than in equities because the market runs 24/7 and there is no session close to define a bar. Past performance is not indicative of future results. Capital at risk.
The Three White Soldiers is a three-candle bullish reversal pattern characterized by three consecutive long-bodied green candles closing progressively higher. Thomas Bulkowski’s candlestick statistics record it breaking out upward 82% of the time, which is what makes it a reversal signal, while ranking it 32nd of 103 patterns for how far price travels afterwards. Professional traders prioritize high-timeframe (D1/W1) formations to filter out algorithmic noise in the forex and crypto markets.
The Three White Soldiers candlestick pattern functions as a decisive signal of market sentiment shifting from fear to aggression. This rare but powerful formation consists of three long, green candles that close progressively higher, indicating that bulls have reclaimed control from sellers. In the 2026 technical landscape, it serves as a primary benchmark for trend reversal verification.
While traditional analysis focuses purely on the candle shapes, modern 2026 strategies integrate volume profile and RSI divergence to filter out false signals. Understanding the institutional “wick discipline” behind these soldiers is essential for avoiding the liquidity traps common in high-frequency trading environments.
While understanding Three White Soldiers Candlestick Pattern is important, applying that knowledge is where the real growth happens. Create Your Free Forex Trading Account to practice with a free demo account and put your strategy to the test.
What is the Three White Soldiers pattern and how does it form?
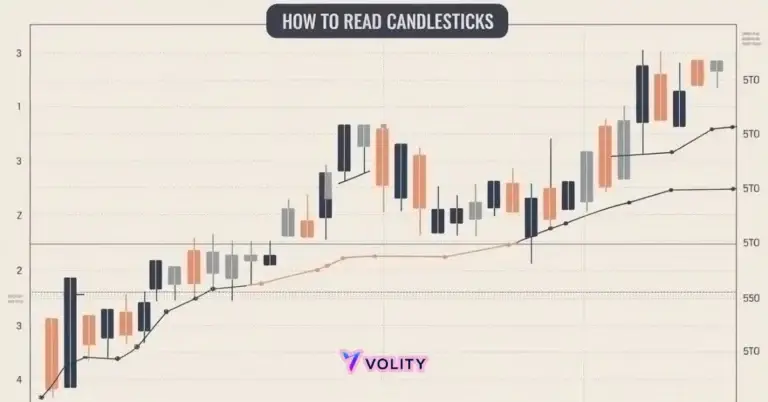
The Three White Soldiers is a three-candle bullish reversal pattern formed by three consecutive long-bodied candles that close progressively higher after a downtrend. Each candle opens within or near the previous candle’s body and closes higher than the prior close, creating a staircase of ascending momentum. The pattern displays “wick discipline”, small upper shadows that demonstrate institutional control, as large wicks suggest seller resistance that undermines signal strength.
- The three strict criteria: Opening within the previous body, higher closes, and small upper wicks
- The role of the “First Soldier” as the regime-change bar
- Why “Wick Discipline” (small upper shadows) is critical for signal strength in 2026
The most widely quoted statistic for this pattern comes from Thomas Bulkowski’s candlestick database: the three white soldiers breaks out upward 82% of the time. That is a measure of breakout DIRECTION, not of trade profitability, and the same database ranks the pattern 32nd of 103 for post-breakout performance. Treat it as evidence that the pattern points the right way, not as a win rate. The first soldier breaks the downtrend by closing above the prior day’s close, signaling that sellers have lost control. The second and third soldiers confirm that buyers maintain the upper hand, accelerating the buying pressure with each successive close.
The Psychology of a Sentimental Pivot
Market sentiment shifts from bearish exhaustion to bullish conviction as the Three White Soldiers force short-sellers to cover their positions. The first candle triggers initial short-covering as bears recognize the downtrend may be ending. The second and third candles accelerate this process, as retail traders observe the pattern forming in real time, FOMO (Fear of Missing Out) buying intensifies the move. However, this FOMO momentum on the third candle is precisely where institutional traders identify liquidity to distribute long positions into, creating the setup for potential reversals.
Ready to Elevate Your Trading?
You have the information. Now, get the platform. Join thousands of successful traders who use Volity for its powerful tools, fast execution, and dedicated support.
Create Your Account in Under 3 MinutesIdentifying the 2026 Criteria for a “Valid” Setup
A valid 2026 Three White Soldiers setup requires increasing trading volume and technical confluence to differentiate from a dead-cat bounce. Without rising volume, the pattern signals weak institutional participation and high probability of failure. Volume Profile analysis shows that candles 2 and 3 must display increasing trading activity relative to candle 1; declining volume on the third soldier is an immediate warning sign.
RSI Confluence dramatically increases pattern reliability. When the Three White Soldiers forms while RSI is rising from below 30 (oversold), the pattern captures the momentum inflection point precisely. RSI readings above 50 suggest sustained bullish strength, while RSI above 70 signals the third candle may mark short-term exhaustion. Breaking above the 50-day SMA provides an additional confirmation layer, institutional traders recognize this moving average as a critical resistance level, and price confirms institutional acceptance by closing above it.
In high-liquidity forex pairs like EUR/USD the formation is cleanest during the London and New York session overlap, when the bar ranges are wide enough for the bodies to be meaningful. The convergence of multiple technical filters, volume increase, RSI recovery and a moving average break, is what separates a tradable setup from a coincidence. See our guide to the RSI indicator for the confirmation step.
A “Valid” 2026 Three White Soldiers setup requires increasing volume on each successive candle; if the third candle shows lower volume than the first, it often signals a lack of institutional follow-through and a high probability of a bull trap.
How to trade the Three White Soldiers: Entry, Stop, and Target
Professional execution of the Three White Soldiers involves entering at the close of the third candle with a stop-loss protected by the low of the first soldier. This approach ensures the pattern is fully formed and confirms that institutional buying has overwhelmed selling pressure. The entry at the close of the third candle captures the momentum acceleration but avoids premature entries before the pattern is validated.
Stop-loss placement is non-negotiable for risk management. The low of the first soldier marks the “Regime Invalidation” level, if price closes below this point on the following day, the entire reversal thesis is invalidated and the trader should exit. Placing the stop above this level creates a reasonable risk buffer while respecting the technical structure.
Profit targets use the nearest prior swing high or a 1:2 Reward-to-Risk ratio as the primary objective. For example, a trade with a 50-pip stop-loss (from entry to first soldier’s low) requires at minimum a 100-pip profit target to justify the risk. Conservative traders scale out halfway at 1:1 reward-to-risk and hold the remainder for larger moves, capturing both the technical bounce and potential breakout momentum.
Worked example, using the rules above rather than a dated trade. Suppose the third soldier closes at 100 and the first soldier’s low sits at 96. The stop is 4 points below entry, so a 1:2 reward-to-risk target is 108, and the position size is whatever makes those 4 points equal your fixed risk per trade. If the next bar closes back below 96 the reversal thesis is invalidated and the trade is over, regardless of how the pattern looked. Past performance is not indicative of future results.
Why the Three White Soldiers Fail: Avoiding the “Bull Trap”
Statistical analysis of failed patterns identifies that low volume and overhead resistance are the primary drivers of Three White Soldiers ‘bull traps’. When volume declines on the third candle relative to the first, institutional participation is waning and retail FOMO is driving the move alone. These setups frequently reverse within 24-48 hours as the institutional accumulation thesis fails.
| Market Context | Signal quality | Volume Trend | Expected Outcome |
| Major Support | Strongest | Increasing | Strong Reversal |
| Mid-Trend | Average | Flat | Continuation |
| Below Resistance | Weakest | Decreasing | Bull Trap |
| Low Liquidity | Poor | Erratic | False Signal |
| Crypto (Small Cap) | Unreliable | Volatile | High Retracement |
Signal quality is a qualitative read of the market context in each row, not a measured win rate. For measured candlestick statistics see Bulkowski’s three white soldiers page and the encyclopedia entries for three white soldiers and candlestick patterns.
Overhead resistance represents the second critical failure driver. When the Three White Soldiers forms just 20-50 pips below major resistance, price often lacks the momentum to penetrate through it. Instead, the move stalls and reverses as sell orders cluster at the resistance level. That asymmetry is the practical rule: a reversal off major support has room to run, while the same three candles pressed up under resistance are running out of it. Read the level before you read the candles, and manage the trade with a stop placed on structure.
WARNING: Avoid trading “Overextended Soldiers” where the candles are excessively long relative to recent price action; these setups often lead to immediate 50% retracements as the market becomes short-term overbought on the RSI.
Comparison: Three White Soldiers vs. Three Black Crows
The Three Black Crows is the bearish mirror of the Three White Soldiers, signaling a top-level reversal with three long-bodied red candles. While both patterns serve as reversal signals, their behavioral characteristics differ substantially. The Three White Soldiers forms after a downtrend has exhausted sellers; the Three Black Crows forms after an uptrend has exhausted buyers.
Psychological dynamics distinguish the two patterns. Fear dominates the Three Black Crows as retail traders panic-sell after realizing an uptrend has peaked. This panic accelerates the sell-off, causing Crows reversals to move faster and more violently than Soldiers reversals. Greed drives the Three White Soldiers as retail traders experience FOMO, causing the reversal to be slower and more orderly. This difference explains why Three Black Crows patterns typically generate faster percentage moves but with higher volatility, while Three White Soldiers creates steadier, more sustainable reversals.
💡 KEY INSIGHT: Institutional traders often wait for a “Liquidity Sweep” of the third soldier’s high before entering; this ensures that retail “FOMO” buyers have already provided the necessary liquidity for a sustained move.
Pattern Efficacy in Crypto and Intraday Trading
Intraday and crypto environments require stricter ‘wick discipline’ to account for the higher frequency of 24/7 market noise. Intraday charts suffer from extreme volatility and algorithmic stop-hunting, making perfectly-formed patterns rare. When they do appear, the pattern’s reliability improves significantly with each additional confluence factor, RSI divergence, moving average alignment, and volume validation become mandatory, not optional.
The 4-hour (H4) chart serves as the “sweet spot” for forex pattern reliability. Daily charts provide the most reliable signals but enter slowly; the 1-hour chart generates frequent false signals due to news-driven volatility; the 4-hour chart balances institutional structure visibility with acceptable entry timing. Crypto patterns benefit most from RSI(21) confirmation, the extended RSI period filters out the short-term noise that plagues standard RSI(14) readings on volatile altcoins.
Turn Knowledge into Profit
You have done the reading, now it is time to act. The best way to learn is by doing. Open a free, no-risk demo account and practice your strategy with virtual funds today.
Open a Free Demo AccountKey Takeaways
- Three White Soldiers is a three-candle bullish reversal pattern that signals a decisive shift from bearish to bullish market control.
- Increasing volume on each successive candle is the primary 2026 requirement for verifying institutional conviction behind the signal.
- Bulkowski’s candlestick database records an upward breakout 82% of the time, which is a direction statistic rather than a win rate.
- Bull traps frequently occur when the pattern forms directly below major resistance or on declining volume, leading to immediate reversals.
- Stop-loss placement should be secured below the low of the first candle in the formation to protect against short-term volatility.
- Crypto charts are noisier than equities because there is no session close, so RSI confluence is what filters out fakeout signals in digital assets.
Frequently Asked Questions
Related reading on Volity: candlestick patterns, market reversals, volume divergence and technical indicators for trading. This article contains references to Three White Soldiers Candlestick Pattern, Bullish Reversals, and Volity, a regulated CFD trading platform. This content is produced for educational purposes only and does not constitute financial advice or a recommendation to buy or sell any financial instrument. Always verify current regulatory status and platform details before using any trading service. Some links in this article may be affiliate links.