A drawdown in trading is the peak-to-trough decline in an investment account’s value, measured as the percentage loss from its last equity high. It is the most critical metric for measuring the realistic risk of a trading strategy, as even profitable systems experience periods of loss.
For example, if your account grows to a peak of $10,000 and then falls to $8,000 before moving higher, it has experienced a 20% drawdown.
Understanding the different types of drawdown—and how to manage them—is essential for long-term survival, managing trading psychology, and ensuring the safety of your portfolio.
Key Takeaways
- Drawdown in trading is the percentage decline from an account’s peak to its lowest point before recovery.
- Forex drawdowns are amplified by leverage, where small price moves can trigger large equity losses and even margin calls.
- Drawdown recovery is asymmetrical: a 20% loss requires a 25% gain to break even, while a 50% loss needs 100%.
- Healthy drawdown levels: hedge funds aim for <10%, while retail traders often tolerate 10–20%.
- Managing drawdowns: use strategy diversification, volatility-adjusted position sizing, strict risk-per-trade rules, and stop-losses.
What is Drawdown in Forex?
In the Forex market, drawdown is magnified by leverage. Because traders can control large positions with a small amount of margin, even minor pip movements can lead to significant swings in account equity.
A Leveraged Forex Drawdown Example
Imagine a trader has a $10,000 account and uses 50:1 leverage to open a 1-lot (100,000 units) position on EUR/USD.
- A 200-pip move against this position would result in a ~$2,000 loss.
- This represents a 20% drawdown on the account from a single trade.
- This is why traders monitor equity drawdown (which includes unrealized losses on open trades). A deep equity drawdown can trigger a margin call, where the broker forces positions to be closed. (This is also known as a floating drawdown, a key metric for leveraged traders).
Drawdown in Forex vs. Stocks vs. Crypto
| Aspect | Forex | Stocks | Crypto |
| Typical Volatility | Low (<1% daily moves on majors) | Moderate | Extremely High (5-15%+ daily moves) |
| Leverage Impact | High (magnifies drawdown speed) | Lower (typically 2:1 – 4:1) | Varies (often lower than Forex) |
| 24-Hour Market Impact | Yes (risk of overnight gaps) | No (gaps occur at market open) | Yes (continuous 24/7 risk) |
| Recovery Speed | Can be slow in ranging markets | Varies by sector and market cycle | Can be extremely fast (both down and up) |
The Basics of Drawdowns in Investing
In broader investing, a drawdown measures the decline from a peak to a trough within a market cycle. It is a key indicator of downside risk and is distinct from other metrics:
- Drawdown vs. Loss: A drawdown is a temporary peak-to-trough decline. A loss is only realized if an asset is sold for less than its purchase price. An account can be in a drawdown but still be profitable overall from its starting capital.
- Drawdown vs. Volatility: Volatility measures all price fluctuations (up and down), while drawdown only measures the decline from a peak.
Metrics like the Ulcer Index (UI) are used to quantify the depth and duration of a drawdown, reflecting the “stress” it places on an investor.
Types of Drawdown
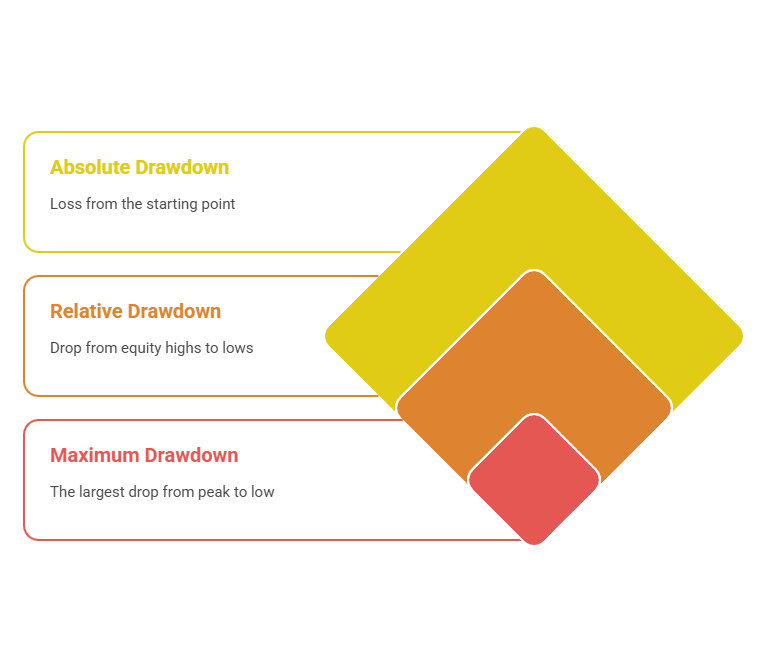
Drawdown shows how much your account falls during a loss. In trading, there are three main types: absolute, relative, and maximum. Each tells a different story about your risk.
- Absolute drawdown measures how far your balance drops below your starting point. If you begin with $10,000 and fall to $9,000, your absolute drawdown is $1,000. According to ForexBee, this helps track your worst-case loss from your original deposit.
- Relative drawdown looks at equity highs and lows during open trades. It shows unrealized losses. If equity goes from $10,500 to $9,500, the $1,000 drop is your relative drawdown. This form, as explained by ForexBee, is useful when watching floating profit and loss.
- Maximum drawdown is the biggest drop from any peak to any low. For instance, a fall from $30,000 to $7,000 is a $23,000 max drawdown. ForexBee confirms this is the most important type for long-term analysis.
In fact, traders use all three to check strategy safety. Absolute shows loss from the start, relative shows risk during trades, and max shows the worst total fall.
How to Calculate Maximum Drawdown (MDD)?
Calculating MDD is a straightforward process that quantifies the greatest loss from a single peak in your equity curve.
The formula is:
MDD(%)=Peak Value(Peak Value−Trough Value)×100
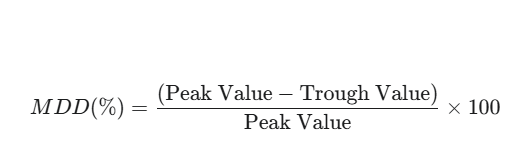
Step-by-Step Example:
- Identify the Peak Value: A trader’s account grows to a peak of $50,000.
- Identify the Subsequent Trough Value: After a series of losses, the account falls to a low of $35,000 before recovering.
- Calculate the MDD:
- ($50,000 – $35,000) / $50,000 = 0.30
- 0.30 × 100 = 30%
The maximum drawdown for this period was 30%.
What is a Healthy Drawdown Level?
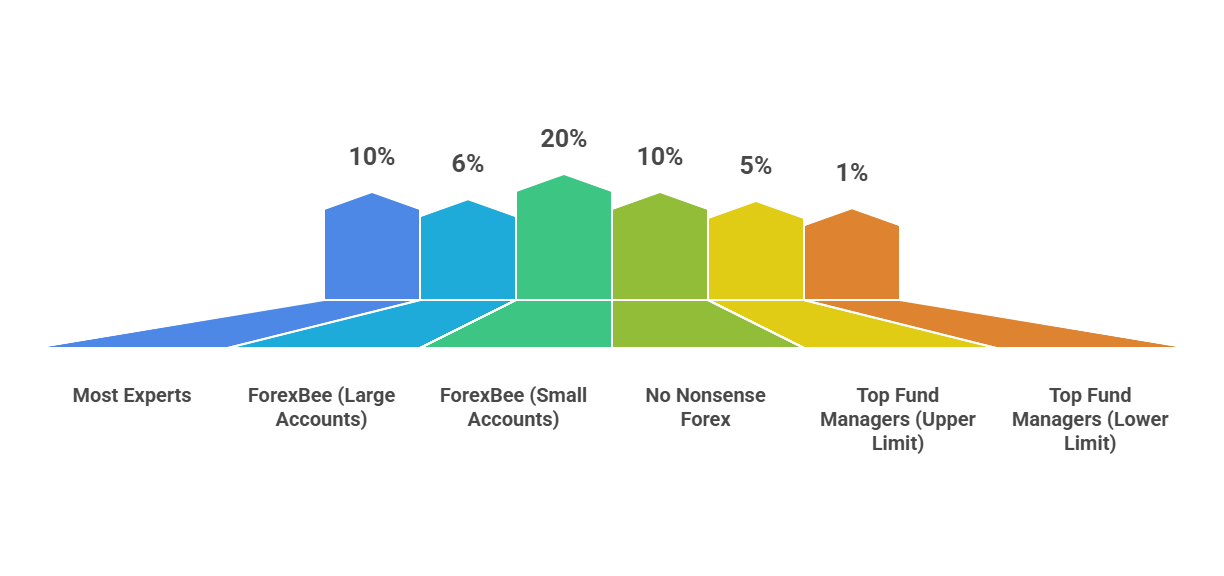
A “healthy” drawdown level is subjective and depends on risk tolerance, but there are industry benchmarks.
- Hedge Funds & Institutional Traders: Often aim for a maximum drawdown of 1-5%. A low drawdown is critical for maintaining investor confidence and managing large amounts of capital.
- Retail Traders: A maximum drawdown of 10-20% is often considered acceptable. Many experienced traders will not tolerate a strategy that has historically exceeded a 20% drawdown.
- The “5% Rule”: This is a common risk management principle where a trader might stop trading a strategy or reduce position size if it enters a 5% drawdown from its peak.
What are the Causes of Drawdowns in Trading?
Drawdowns are caused by a combination of market dynamics and trader behavior.
- Leverage: Excessive leverage magnifies the size of losing trades, leading to rapid and deep drawdowns.
- Poor Risk Management: Failing to use a stop-loss or risking too much capital on a single trade is a primary cause of severe drawdowns.
- Over-Optimized Backtests: A strategy that is “curve-fit” to historical data may look perfect on paper but will experience severe drawdowns in live market conditions.
- Hidden Portfolio Correlation: Holding multiple positions that seem different but are highly correlated (e.g., being long on several JPY pairs at once) can lead to a much larger drawdown than expected if that single theme moves against you.
- Trading Psychology: Emotional decisions, such as revenge trading after a loss, can turn small drawdowns into account-destroying events.
How to Manage and Reduce Drawdowns?
Drawdowns are unavoidable, but they can be managed with a disciplined approach to risk.
- Strategy Diversification (The #1 Technique): The most powerful tool for reducing portfolio drawdown is combining multiple, uncorrelated trading systems.
- Volatility-Adjusted Position Sizing: This technique involves using the Average True Range (ATR) to calculate position size, taking smaller positions when an asset is highly volatile.
- Strict Risk-Per-Trade Rules: Never risk more than 1-2% of your trading capital on any single trade.
- Use Stop-Losses and System Rules: A hard stop-loss is essential for defining your maximum loss.
- Choosing strategies designed to minimize drawdown is equally important, since your method determines how well losses are controlled across market cycles.
Real-World Examples of Drawdowns
Real-world drawdowns happen fast and cut deep. They highlight the need for risk controls, asset mix, and mental readiness.
| Event | Asset/Market | Drawdown % | Details | Source |
| 2015 China Stock Market Crash | Shanghai Composite Index | 43% | Dropped from peak in June to trough in August 2015. | The Trading Analyst |
| 2020 Oil Price Crash | WTI Crude Oil Futures | ~100%+ | Oil futures went below zero, wiping out portfolios with energy exposure. | The Trading Analyst |
| Hypothetical: Forex Equity Dip | Personal Trading Account | 10% | The account falls from $10,000 to $9,000 before rising again. | ForexBee |
| Hypothetical: Max Drawdown Scenario | Investment Portfolio | 30% | Portfolio drops from $100K to $70K before recovery. | The Trading Analyst |
| Retail Trader Sentiment (Forum Data) | Mixed Assets | 10%–20% | Most traders on Forex Factory prefer drawdowns under 20% for comfort. | Forex Factory |
Portfolio Management with Drawdown-Based Measures
Professional portfolio managers use drawdown as a core metric for asset allocation and performance evaluation. These ratios are crucial for measuring a fund’s drawdown recovery efficiency.
Advanced Drawdown-Based Ratios
- Calmar Ratio: Compares a strategy’s average annual rate of return to its maximum drawdown. A higher Calmar ratio indicates better risk-adjusted returns.
- Sterling Ratio: Similar to the Calmar Ratio but uses the average drawdown instead of the maximum, providing a smoother performance measure.
- Recovery Factor: Calculated as the total net profit divided by the maximum drawdown. It shows how many times the strategy has covered its worst loss.
Psychological Impact of Drawdowns
The psychological pressure of a drawdown is one of the biggest challenges in trading. It can trigger destructive emotional responses.
- Common Reactions: Fear, revenge trading, and abandoning a sound strategy prematurely (“system hopping”).
- Coping Strategies:
- Strictly follow a pre-defined trading plan.
- Use a trading journal to maintain objectivity.
- Run Simulated Drawdown Stress Tests: Before trading live, use backtesting software to simulate your strategy’s worst historical drawdown. This builds the mental resilience to endure it with real capital.
- Use Risk Journaling: Record your emotional state during losing streaks. This helps identify patterns where fear or greed might be worsening your drawdowns.
The Asymmetrical Math of Drawdown Recovery
A crucial concept for traders is that the percentage gain required to recover from a drawdown is always larger than the drawdown percentage itself. This difficulty increases exponentially.
Drawdown Recovery Requirements
| If you lose… | You need to gain… |
| 10% | 11.1% |
| 20% | 25% |
| 30% | 42.9% |
| 50% | 100% |
| 75% | 300% |
Recovery Time: The Hidden Challenge
The math is only half the story; the time it takes to recover also matters. A long time-in-drawdown is often more psychologically difficult to endure than a steep but short one.
| Event | Max Drawdown (S&P 500) | Approximate Recovery Time |
| Tech Bubble Burst | ~49% | ~7 years |
| 2008 Financial Crisis | ~57% | ~5.5 years |
| COVID-19 Crash | ~34% | ~5 months |
Final Thoughts
Drawdown is the most realistic measure of risk in trading because it quantifies the actual decline in capital that a trader endures. While it is an unavoidable part of trading, it is not unmanageable.
By understanding the different types of drawdown, implementing robust risk management techniques like strategy diversification, and maintaining psychological discipline, you can control its impact on your portfolio. Ultimately, how a trader handles drawdowns is what separates a resilient, long-term career from a short-lived one.