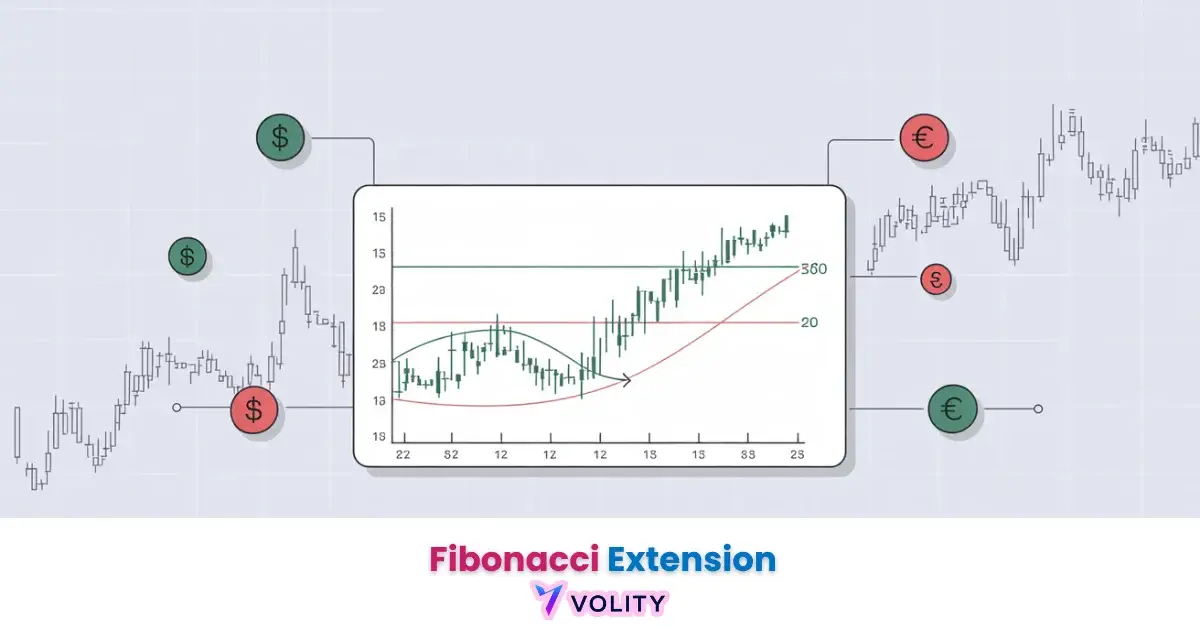
Fibonacci Extensions are a technical analysis tool that projects potential support and resistance levels beyond a completed price move and subsequent retracement. These extensions are used to identify profit targets and potential reversal zones in trending markets. This guide will explain how to accurately draw and apply Fibonacci Extensions, combine them with other indicators, and manage risk for more precise trading decisions.
While understanding Fibonacci Extensions is important, applying that knowledge is where the real growth happens. Create Your Free Forex Trading Account to practice with a free demo account and put your strategy to the test.
Understanding Fibonacci Extensions
The Fibonacci sequence appears widely in nature, from plant patterns to spiral galaxies, suggesting a universal mathematical order that also influences market psychology.
Defining Fibonacci Extensions and Their Purpose
Fibonacci Extensions are projected levels that extend beyond a price swing, indicating where a market trend might reach its next significant turning point or profit target. Traders use them to forecast how far a price move might go after a retracement.
Their primary purpose in the Forex market is to provide objective levels for setting take profit levels and anticipating potential points where a trend might pause or reverse.
Fibonacci Extensions vs. Retracements
Fibonacci Extensions and Fibonacci Retracement levels serve distinct but complementary roles in technical analysis. While retracements help identify potential entry points within a trend, extensions project potential exit points or targets where a trend might culminate.
The core difference lies in their application: retracements measure pullbacks within a trend, whereas extensions forecast price movement beyond previous highs or lows.
| Feature | Fibonacci Retracement | Fibonacci Extension |
|---|---|---|
| Purpose | Entry points, pullbacks | Profit targets, reversals |
| Measurement | Within existing trend | Beyond existing trend |
| Levels | 23.6%, 38.2%, 50%, 61.8% | 127.2%, 161.8%, 200%, 261.8% |
| Use Case | Buying dips in uptrends | Selling rallies in downtrends |
| Focus | Trend continuation | Trend completion/extension |
Key Fibonacci Extension Levels
The key Fibonacci extension levels are 127.2%, 161.8%, 200%, and 261.8%, derived from the Fibonacci ratios. These levels represent potential areas where price action may find resistance in an uptrend or support in a downtrend.
Drawing them correctly involves identifying three specific points: a swing low to swing high for an uptrend, or a swing high to swing low for a downtrend, followed by the retracement point.
To draw Fibonacci Extensions correctly:
- Identify the Trend: Determine if the market is in an uptrend or downtrend.
- Select Swing Points: For an uptrend, click the Fibonacci tool at a significant swing low (Point 1), drag to the subsequent swing high (Point 2), and then drag to the retracement low (Point 3). For a downtrend, it’s a swing high (Point 1), swing low (Point 2), and retracement high (Point 3).
- Project Levels: The tool will then project the extension levels (127.2%, 161.8%, etc.) beyond the swing high or low, indicating potential future price targets.
Identifying Trend & Price Action for Effective Extension Application
Effective application of Fibonacci Extensions relies heavily on accurately identifying the prevailing trend and understanding price action around key levels. The Forex market operates 24/5, offering ample opportunities, but only when traders align their analysis with the market’s underlying direction. Without a clear trend, extension levels can become unreliable, leading to false signals and missed opportunities.
Identifying the Prevailing Trend in the Forex Market
Identifying the prevailing trend in the Forex market is the first step before applying Fibonacci Extensions. An uptrend is characterized by successive higher highs and higher lows, while a downtrend shows lower lows and lower highs. Sideways or ranging markets, conversely, lack a clear direction and are generally unsuitable for extension strategies. Using simple moving averages or visual inspection of price charts helps confirm the trend.
Reading Price Action Around Extension Levels
Reading price action around Fibonacci Extensions provides crucial confirmation signals for potential reversals or continuations. Look for specific candlestick patterns, such as engulfing patterns, pin bars, or dojis, forming directly at or near an extension level. These patterns indicate buyer or seller exhaustion and can signal that a projected target or reversal zone is indeed significant. Consolidation near a level followed by a breakout also confirms its importance.
Best Timeframe for Fibonacci Extensions
The best timeframe to use Fibonacci Extensions depends on a trader’s style, but longer timeframes typically offer more reliable signals. Daily and 4-hour charts tend to provide stronger, more significant potential reversal zones than shorter timeframes like 15-minute charts. Using multiple timeframes for confluence, where higher timeframe extensions align with lower timeframe signals, significantly improves the probability of a successful trade.
Ready to Elevate Your Trading?
You have the information. Now, get the platform. Join thousands of successful traders who use Volity for its powerful tools, fast execution, and dedicated support.
Create Your Account in Under 3 MinutesHow to Combine Fibonacci Extensions with Other Indicators
Fibonacci Extensions can be combined with other indicators through a strategy known as confluence trading, which increases the reliability of trade signals. When an extension level aligns with other technical indicators like Support and Resistance, moving averages, or momentum oscillators, it significantly strengthens the probability of that level holding as a target or reversal point. This approach helps to filter out less reliable signals and focus on high-probability setups.
Combining Extensions with Support & Resistance
Confluence Trading is the practice of using multiple technical analysis tools to confirm a trade idea, dramatically increasing its probability of success. When a Fibonacci Extension level aligns with a strong Support and Resistance zone, its significance as a potential take profit level or reversal point is amplified. This alignment acts as a powerful magnet for price, making it a high-probability area for market turning points. Traders often find that price respects these confluent zones much more reliably than isolated extension levels.
Using Momentum and Oscillators for Confirmation
Momentum indicators and oscillators can provide additional confirmation when price approaches Fibonacci Extensions. Tools like the Relative Strength Index (RSI) or the Moving Average Convergence Divergence (MACD) can signal overbought or oversold conditions at an extension level, suggesting an impending reversal. For example, if price hits the 161.8% extension level while the RSI is showing strong bearish divergence, it adds weight to the idea of a potential reversal.
How to Trade Fibonacci Extensions Effectively
An effective Fibonacci extension trading strategy involves identifying a clear trend, drawing extensions from significant swing points, and then using these levels for take profit levels and potential reversals. The 161.8% and 261.8% Fibonacci extension levels are statistically significant for identifying potential reversal zones in strong trends. A robust strategy integrates these levels with precise entry and exit rules, along with strict risk management.
Step-by-Step Trading Strategy
Building a trading strategy with Fibonacci Extensions involves a systematic approach to market analysis and trade execution. This strategy often begins with identifying a strong trend, then using Fibonacci Retracement to pinpoint optimal entry points during a pullback. The extensions then guide the exit strategy by defining clear profit targets. This structured approach helps address the common pain point of knowing if an extension level is strong enough, by integrating it into a broader, validated framework.
Here’s a step-by-step example for an uptrend:
- Identify an Uptrend: Look for higher highs and higher lows.
- Draw Retracement: From swing low to swing high to identify a pullback entry (e.g., 50% or 61.8% retracement).
- Enter Trade: Buy at the retracement level with confirmation (e.g., bullish candlestick pattern).
- Draw Extension: From the initial swing low, to the swing high, then to the retracement low where you entered.
- Set Take Profit: Target the 127.2%, 161.8%, or 200% extension levels.
- Set Stop Loss: Place the stop loss below the retracement low or a significant support and resistance level.
Setting Profit Targets with Fibonacci Extensions
Fibonacci Extensions help set take profit levels by providing objective price targets beyond a significant price move. The 127.2%, 161.8%, 200%, and 261.8% levels are commonly used as primary and secondary targets for profit-taking. For instance, traders might aim for the 161.8% extension as a first target, and if momentum continues, scale out partially or entirely at the 200% or 261.8% levels. This systematic approach allows traders to capture substantial gains while managing their exposure.
| Extension Level | Typical Strategy Application |
|---|---|
| 127.2% | Initial target for strong, fast moves |
| 161.8% | Primary profit target, statistically significant |
| 200% | Secondary target, strong trend continuation |
| 261.8% | Extended target, potential trend exhaustion |
How to Manage Risk with Fibonacci Extensions
Managing risk with Fibonacci Extensions involves strategically placing stop losses and understanding position sizing in relation to potential volatility. Only 15% of retail traders consistently use a defined risk management strategy, leading to significant account depletion over time. Effective risk management ensures that even if an extension level fails, the capital loss is contained and does not jeopardize the trading account.
Essential Risk Management for Fibonacci Extension Traders
Risk Management is paramount when trading with Fibonacci Extensions. Traders should always define a stop loss level before entering a trade, typically placed below a significant support and resistance level or a previous swing low/high, to invalidate the setup. Position sizing should be adjusted based on the distance to the stop loss and the desired risk percentage per trade (e.g., 1-2% of capital). This disciplined approach protects capital, especially given the inherent volatility of the Forex market.
Common Mistakes When Using Fibonacci Extensions
Common mistakes when using Fibonacci Extensions include incorrect selection of swing high to swing low points, which leads to inaccurate extension levels. Another frequent error is ignoring confluence, meaning relying solely on extensions without confirmation from other indicators like Support and Resistance or price action. Over-leveraging positions based on a single extension signal, and neglecting a predefined stop loss, also contribute to significant losses.
Psychology of Trading and Common Pitfalls
The Psychology of Trading is a critical, yet often overlooked, aspect of using Fibonacci Extensions. Emotional discipline accounts for up to 60% of trading success, outweighing technical skill alone for consistent profitability. Common psychological pitfalls include over-reliance on a single extension level, confirmation bias (only seeing what supports your trade), and fear of missing out (FOMO) when price moves quickly towards an extension. Sticking to a predefined trading strategy and maintaining emotional detachment is crucial for long-term success.
Which Trading Platforms Support Fibonacci Extension Tools?
Most modern trading platforms support Fibonacci extension tools, providing traders with the functionality to apply these projections directly onto their charts. Platforms like MetaTrader 4 (MT4), MetaTrader 5 (MT5), TradingView, cTrader, and Oanda’s proprietary platform are popular choices that offer intuitive drawing tools for Fibonacci Extensions. These platforms typically allow customization of the extension levels, colors, and styles to suit individual preferences.
Popular Platforms with Integrated Fibonacci Extension Tools
Popular platforms with integrated Fibonacci Extension tools include MetaTrader 4 (MT4) and MetaTrader 5 (MT5), which are industry standards for Forex trading. TradingView offers a highly customizable and user-friendly interface for drawing and analyzing extensions across various assets. Other platforms such as cTrader and Oanda also provide robust Fibonacci tools. These platforms make it easy to identify swing high to swing low points and project the key extension levels onto your charts with precision.
Exploring Automated Trading Systems with Fibonacci Extensions
Automated Trading Systems, also known as Expert Advisors (EAs) in MetaTrader, can incorporate Fibonacci Extension logic to execute trades without manual intervention. These systems can be programmed to identify specific swing points, draw extensions, and place entry, take profit, and stop loss orders automatically when price reaches predefined extension levels. While offering benefits like removing emotion and 24/5 trading, developing or using such systems requires thorough backtesting and optimization to avoid over-fitting and adapt to changing market conditions.
Turn Knowledge into Profit
You've done the reading, now it's time to act. The best way to learn is by doing. Open a free, no-risk demo account and practice your strategy with virtual funds today.
Open a Free Demo AccountMaking Fibonacci Extensions More Objective
Fibonacci Extensions can sometimes feel subjective due to the discretion involved in selecting swing points. However, traders can make them more objective by combining them with advanced technical analysis tools like Volume Profile and basic order flow concepts. This approach helps to validate the significance of extension levels, moving beyond simple price projections to identify areas of genuine institutional interest. Integrating these techniques directly addresses the pain point that Fibonacci seems too subjective by providing data-driven confirmation.
Validating Fibonacci Levels with Volume Profile and Order Flow
To make Fibonacci Extensions more objective, traders can integrate them with advanced tools like Volume Profile and basic order flow analysis. Volume Profile identifies price levels where significant trading volume has occurred, creating strong support and resistance levels. When a Fibonacci extension level aligns with a high-volume node from the Volume Profile, it significantly increases its validity as a potential reversal zone or profit target. Observing order flow for signs of institutional buying or selling pressure at these confluent levels adds another layer of confirmation, making the analysis less subjective and more data-driven.
Why Extensions Sometimes Fail: Confluence & Market Sentiment
If your Fibonacci Extensions sometimes fail, it’s often due to a lack of confluence trading or an unawareness of broader market sentiment. Strong fundamental news releases, unexpected economic data, or shifts in central bank policy can override even the most technically sound Fibonacci levels. Integrating market sentiment analysis involves monitoring news calendars, economic reports, and even sentiment indicators to gauge the overall market mood. When strong sentiment opposes a technical level, it signals a higher probability that price will blow through it, improving trade timing and risk management.
Key Takeaways
- Fibonacci Extensions project profit targets and potential reversal zones beyond a price swing.
- They differ from Fibonacci Retracement by focusing on exit points rather than entry points.
- Confluence Trading, combining extensions with Support and Resistance and price action trading, significantly enhances reliability.
- Effective risk management and emotional discipline are as crucial as technical skill for long-term success.
- Advanced validation techniques like Volume Profile and market sentiment reduce the subjectivity of Fibonacci analysis.
The Bottom Line
Mastering Fibonacci Extensions in Forex transforms a trader’s ability to identify precise take profit levels and anticipate potential reversal zones. This guide has explored the core mechanics of extensions, their critical distinction from retracements, and how to correctly draw and apply them within a trading strategy. Crucially, it emphasizes the power of confluence trading—combining extensions with Support and Resistance and price action—to validate trade setups. Furthermore, addressing the Psychology of Trading and incorporating advanced validation techniques like Volume Profile and market sentiment offers a holistic approach, enabling traders to move beyond subjectivity and achieve more consistent profitability in the dynamic Forex market.