The main difference between a golden cross and a death cross is the direction of the moving average crossover. A golden cross occurs when the 50-day moving average crosses above the 200-day, signaling a bullish trend. A death cross happens when it crosses below, signaling a bearish trend.
While they appear to be simple mirror images, the Golden Cross and Death Cross have key differences that can significantly impact your trading approach.
Key Takeaways
- Golden Cross (50-day MA over 200-day) is a bullish signal, while a Death Cross (50-day MA under 200-day) is a bearish signal.
- Never rely on these crossover signals alone, as they can produce false signals in volatile or sideways markets.
- Always confirm the trend with other indicators like RSI, MACD, or trading volume for better accuracy.
- Traders typically use the Golden Cross as a potential buy signal and the Death Cross as a signal to sell or be cautious.
- These signals are most reliable on higher timeframes like the daily or weekly charts and in less volatile markets like stocks.
- Use a faster EMA for short-term trading signals or a smoother SMA for more reliable, long-term trend analysis.
What is a Golden Cross?
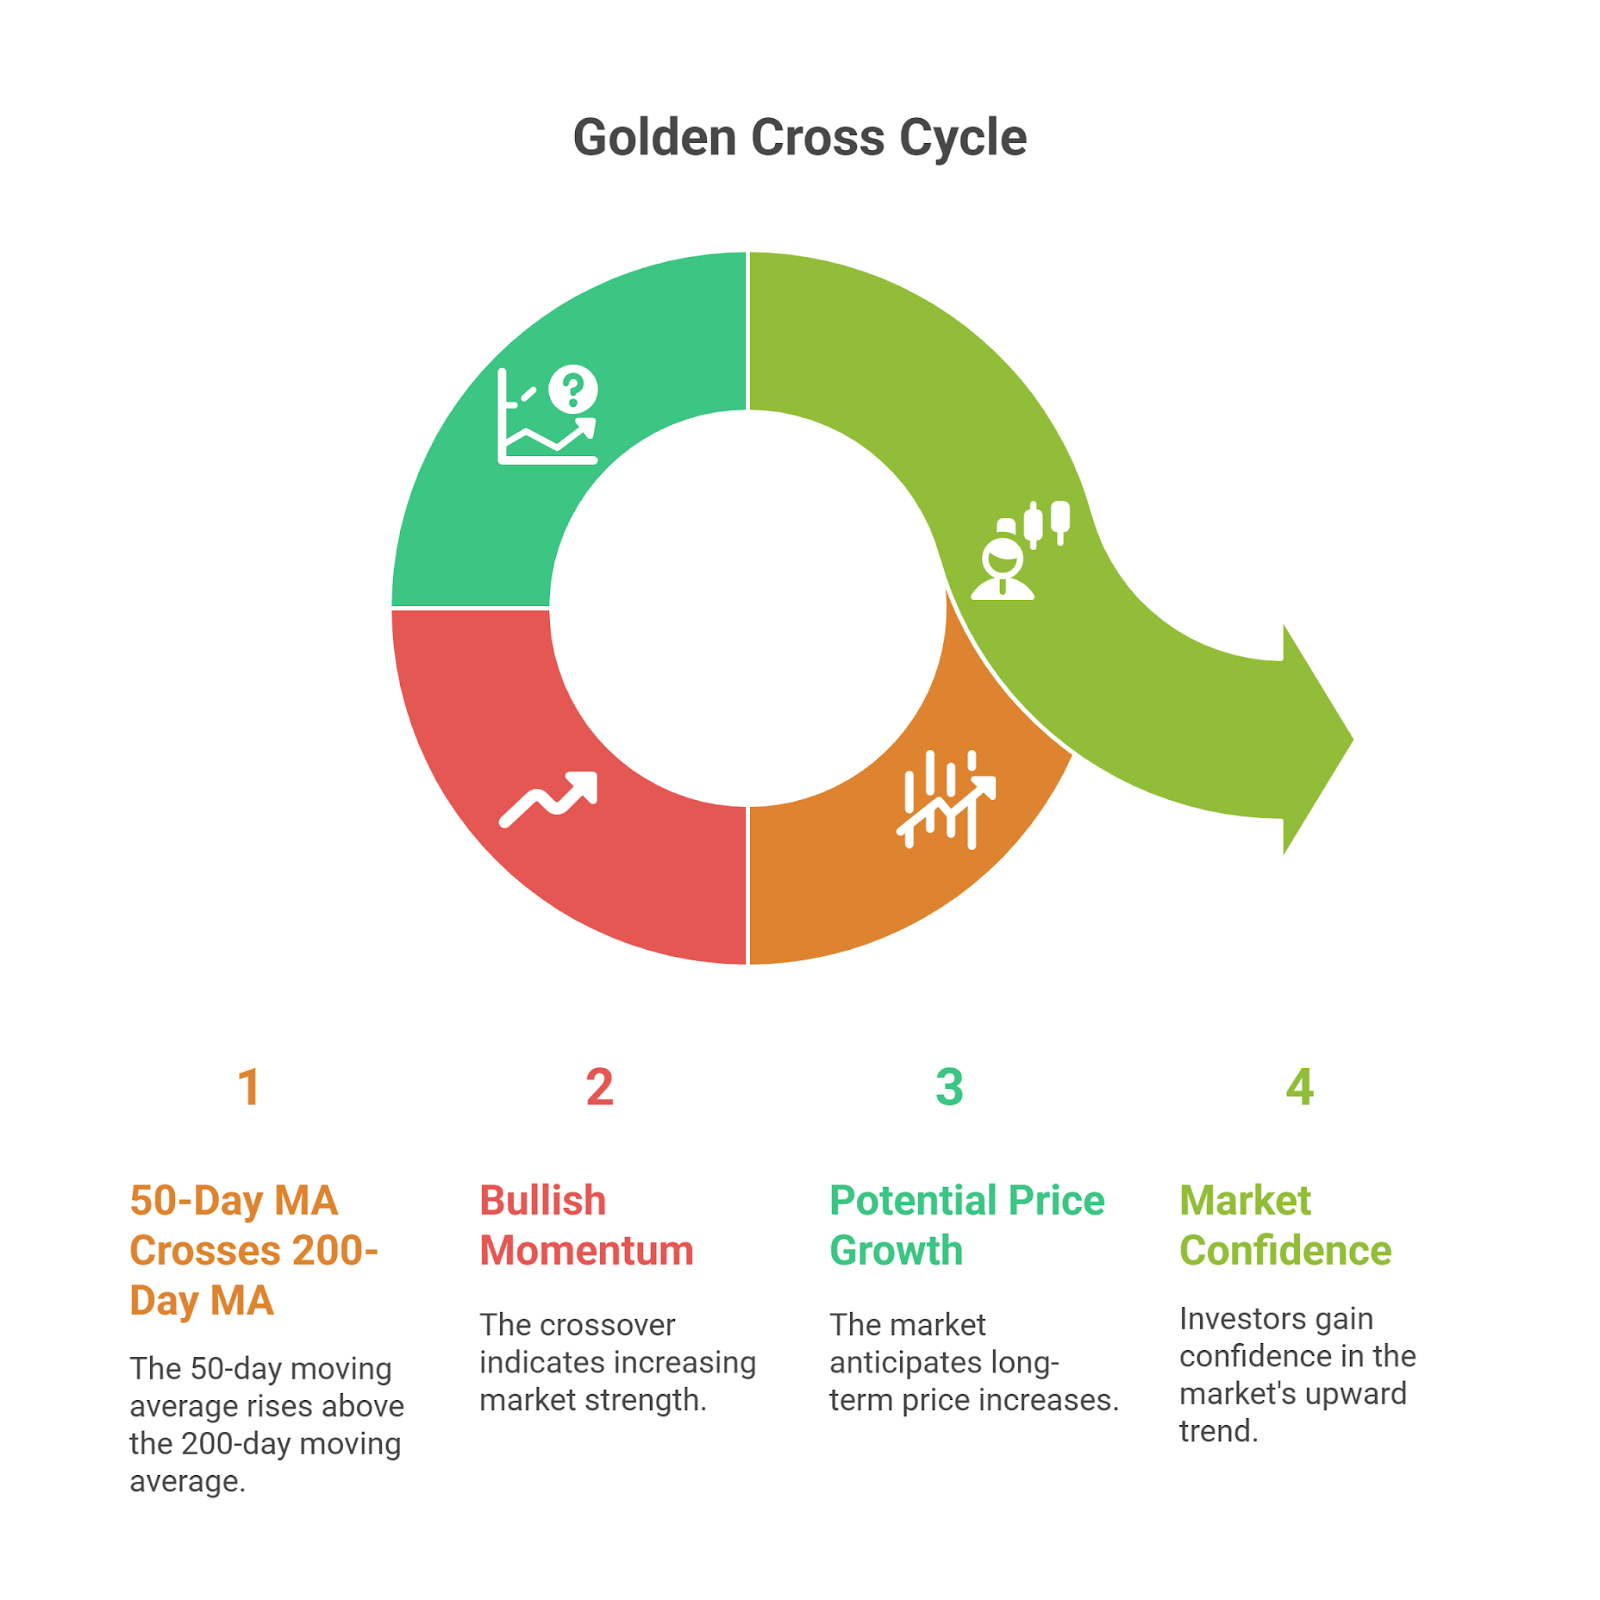
A golden cross is a bullish technical indicator that occurs when the 50-day moving average crosses above the 200-day moving average. This crossover suggests upward momentum and is often seen as a signal for potential long-term price growth in financial markets.

Why do traders rely on the Golden Cross?
It offers a straightforward entry point for buying. Many view it as a reliable indicator of growing optimism in the market. However, no single indicator guarantees success.
Would you use the Golden Cross alone? Many experts suggest pairing it with other tools like volume analysis or momentum indicators. If you are doing so, it helps you confirm the trend and avoid false signals.
What is a Death Cross?
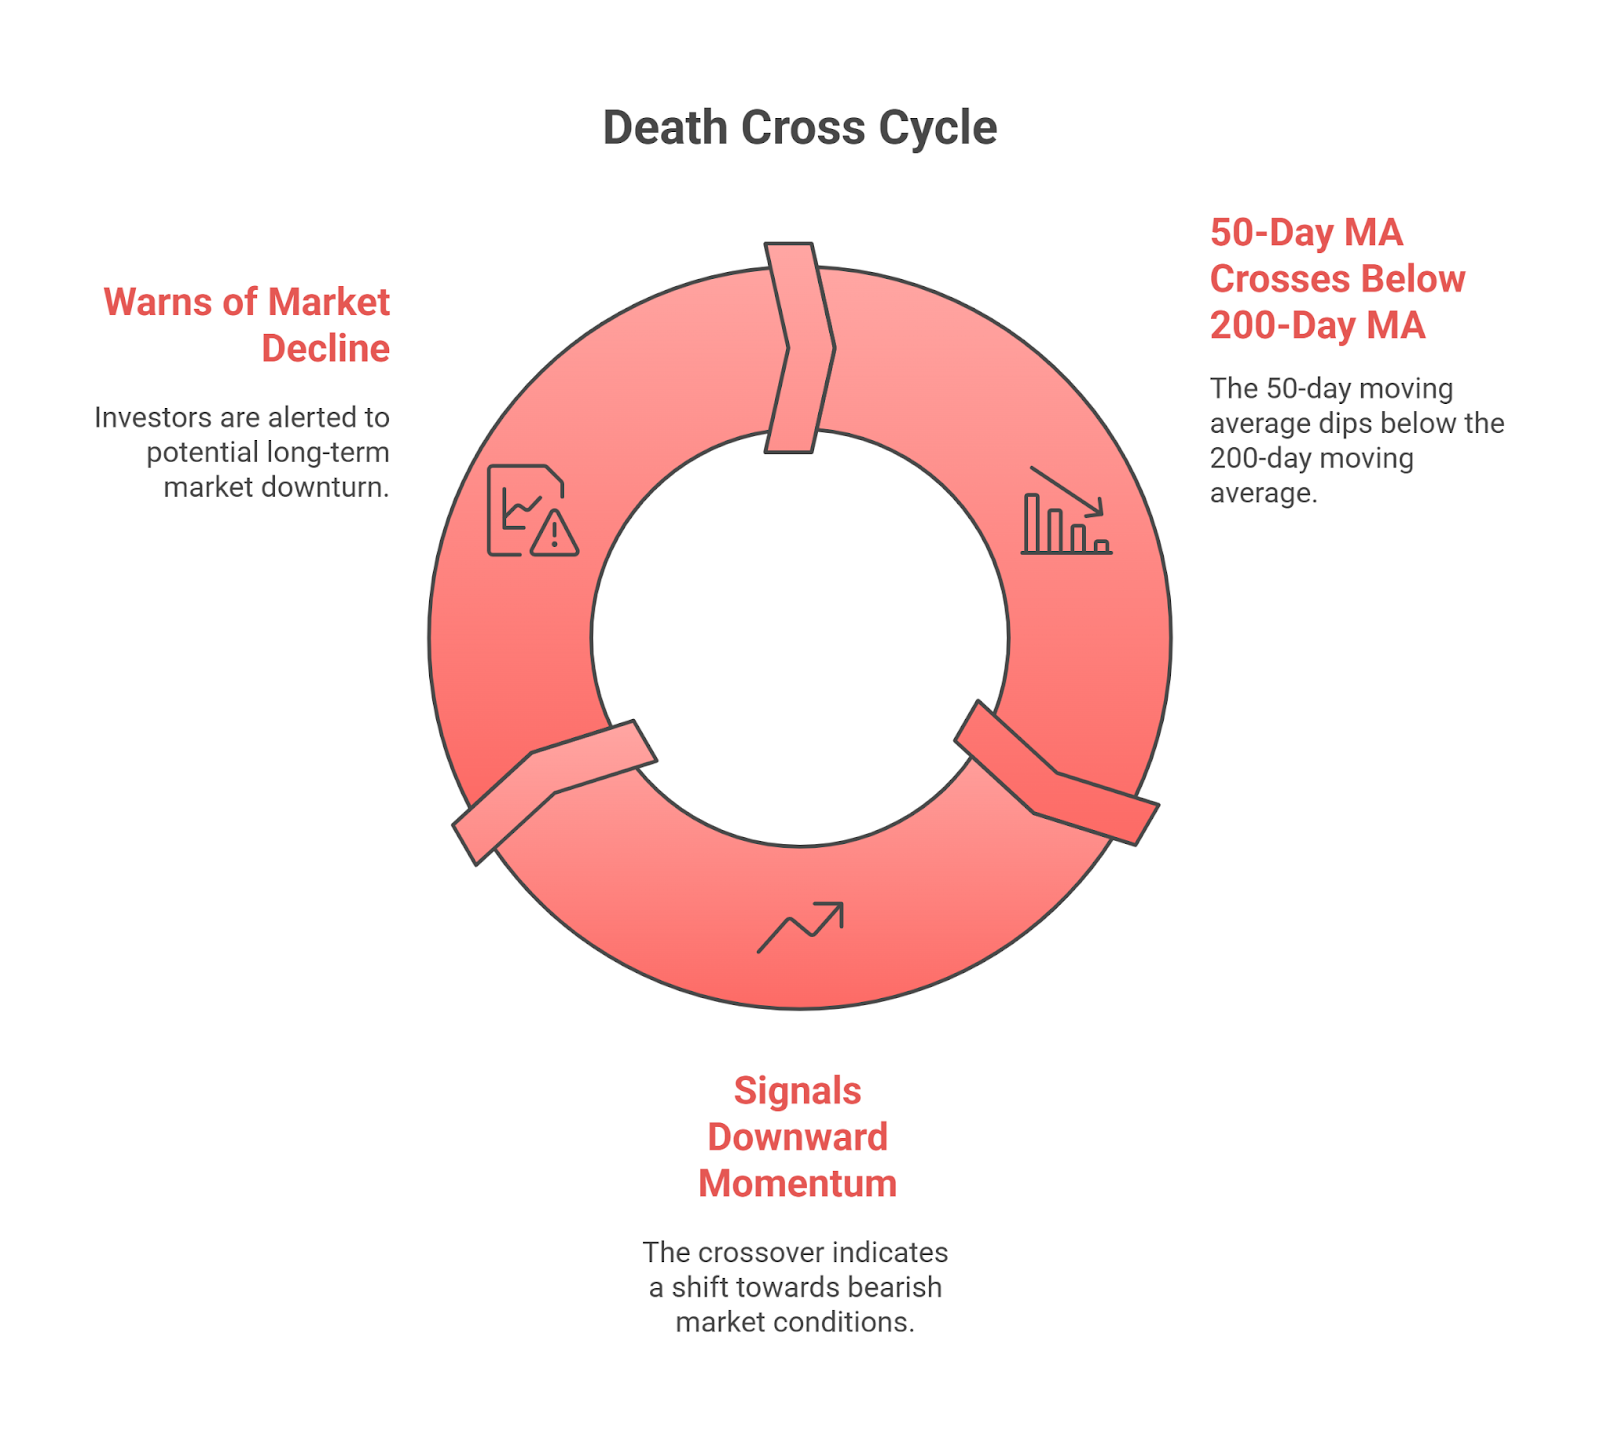
A death cross is a bearish technical indicator that occurs when the 50-day moving average crosses below the 200-day moving average. This crossover signals downward momentum and is often viewed as a warning of potential long-term market decline.

Why does the Death Cross matter to traders? It highlights a shift in market direction. Many use it to rethink their positions or limit exposure to high-risk assets. Should you act immediately? Avoid hasty decisions. You should look at other indicators, such as trading volume or market support levels, to confirm the signal. So—staying cautious can help you avoid unnecessary losses.
Have you come across this pattern before? If you understand its implications, it can prepare you for future trends.
Combining Golden Cross and Death Cross With Other Technical Indicators
If you are using Golden Cross and Death Cross signals, it can provide a clear direction in trading. However, combining them with other technical indicators makes your strategy more reliable. Additional tools help confirm signals and reduce false positives.
Relative Strength Index (RSI)
The RSI shows momentum. A Golden Cross above 50 on the RSI suggests a strong upward trend. If the RSI stays below 50 during a Death Cross, it signals continued downward pressure. You can see—pairing the RSI with cross signals improves your chances of success.
Moving Average Convergence Divergence (MACD)
The MACD tracks momentum. When a Golden Cross happens and the MACD line crosses above the signal line, it confirms bullish movement. A Death Cross followed by the MACD line crossing below the signal line signals stronger bearish momentum. Moreover, combining the two tools gives a clearer picture of market direction.
Volume
The volume provides insight into the strength of the trend. High volume during a Golden Cross indicates a strong trend, while low volume during a Death Cross suggests weakness. Always check the volume when interpreting cross signals to see if it supports the move.
Support and Resistance Levels
Support and resistance levels help you understand price action. A Golden Cross near support adds strength to the signal, suggesting a potential upward move. A Death Cross near resistance confirms a stronger downward trend. Use these levels to check the reliability of cross signals.
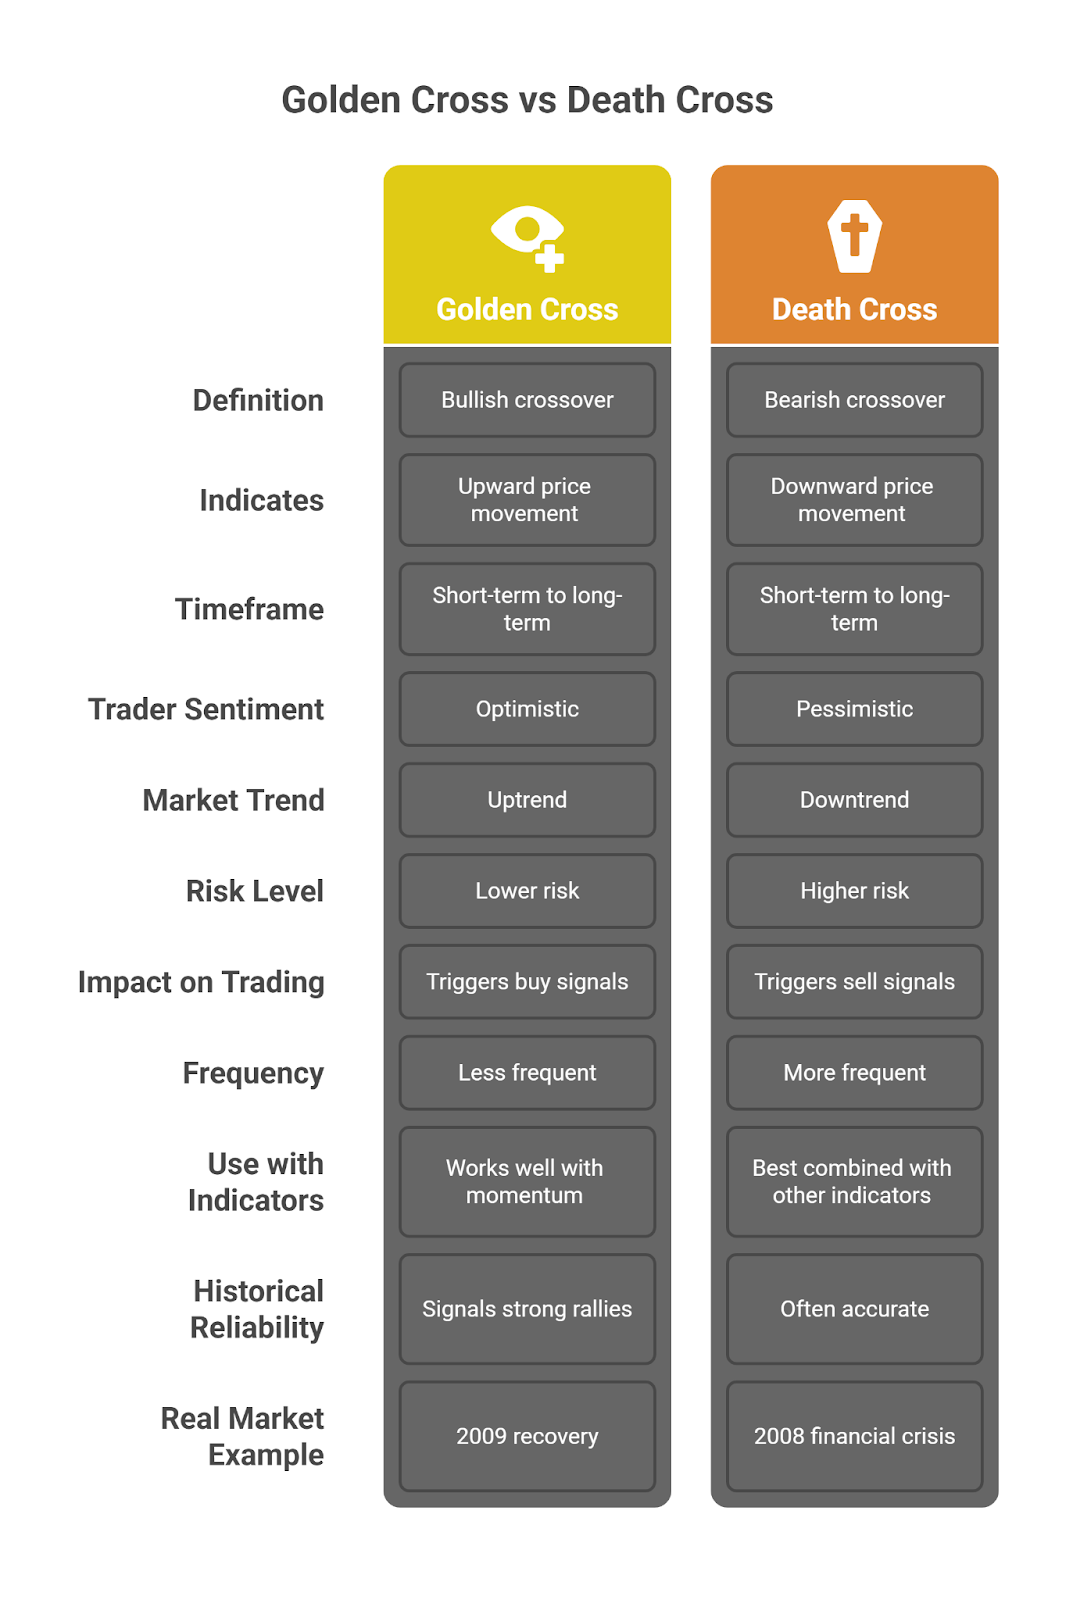
Golden Cross vs Death Cross—Key Differences

| Aspect | Golden Cross | Death Cross |
| Definition | A bullish signal is where the 50-day moving average crosses above the 200-day moving average. | A bearish signal where the 50-day moving average crosses below the 200-day moving average. |
| Indicates | Potential for upward price movement (bullish trend). | Potential for downward price movement (bearish trend). |
| Timeframe | Short-term to long-term signal (valid for weeks or months). | Short-term to long-term signal (valid for weeks or months). |
| Trader Sentiment | Optimistic, expect prices to rise. | Pessimistic, expect prices to fall. |
| Market Trend | Uptrend or emerging uptrend. | Downtrend or emerging downtrend. |
| Risk Level | Lower risk, as it indicates a strong bullish trend. | Higher risk, as it often signals the start of a sustained decline. |
| Impact on Trading | Triggers buy signals, especially in strong bull markets. | Triggers sell signals, especially in bear markets. |
| Frequency of Occurrence | Occurs less frequently. | Occurs more frequently during market corrections or bear markets. |
| Use with Other Indicators | Works well with momentum indicators like RSI or MACD to confirm the trend. | Best combined with other indicators like RSI or MACD to confirm a downtrend. |
| Historical Reliability | Known for signaling strong rallies in the past. | Often accurate, but can sometimes lead to false signals during sideways market conditions. |
| Example in Real Markets | Often seen before market rallies, such as during the 2009 recovery. | Common in bear markets, such as during the 2008 financial crisis. |
How to Use The Golden Cross And Death Cross in Trading?
Golden Cross and Death Cross provide traders with clear signals. Each pattern helps guide decisions during market shifts. AGolden Cross suggests an opportunity to buy. If short-term averages cross above long-term averages, it points to a potential uptrend. Traders often see this as a signal to enter the market or hold positions for future gains.
A Death Cross signals caution. If short-term averages fall below long-term averages, it indicates a possible downturn. Traders may decide to sell or avoid risky investments during this phase. You should know—timing your actions is also important. But, observing volume alongside, these patterns strengthens the accuracy of predictions. Increased volume during a Golden Cross adds confidence to the bullish trend. Low volume during a Death Cross may hint at a temporary dip instead of a long-term decline.
Have you considered combining these patterns with other indicators? Tools like RSI or MACD can provide additional insights, ensuring a well-rounded trading strategy.
Success Rate and Limitations of Golden Cross And Death Cross
Golden Cross and Death Cross can guide trading strategies, but they are not perfect. You need to understand both their strengths and weaknesses to avoid costly mistakes. Golden Cross patterns are often associated with bullish trends. Many traders see them as a reliable signal for entering long-term positions during market upswings. However, they may fail in volatile or sideways markets. False signals occur when short-term gains mislead you into thinking a longer trend is forming.
Death Cross patterns usually indicate prolonged bearish movements. They alert traders to exit positions before steep losses. But they are not foolproof. Short-term market corrections can create false alarms, leading to unnecessary exits. Have you considered pairing these indicators with other tools? Moving averages, price trends, and volume analysis add clarity to your decisions. It is suggested that—relying on a single method often increases risks.
No strategy is without flaws. Successful trading depends on diversifying your analysis and staying informed about market conditions. How will you adjust your approach to account for these limitations?
Best Timeframes For Trading Golden Cross and Death Cross
| Timeframe | Golden Cross | Death Cross |
| Daily Chart | Ideal for identifying long-term trends. Offers a clear picture of sustained bullish movement. | Effective for spotting long-term bearish trends. Useful for cautious investors aiming to minimize risk. |
| 4-Hour Chart | Provides mid-term insights. Suitable for swing traders looking to capitalize on medium-term price shifts. | Highlights mid-term bearish signals. Helps traders refine exit points during market downturns. |
| Hourly Chart | Useful for short-term trades. Alerts traders to brief bullish opportunities. | Pinpoints short-term bearish signals. Suitable for traders needing fast responses. |
| Weekly Chart | Best for long-term investors. Confirms significant bullish trends with fewer false signals. | Highlights extended bearish trends. Often used for major portfolio adjustments. |
Should You Use EMA or SMA For Cross Signals?
If it comes to trading Golden Cross and Death Cross signals, choosing between the Exponential Moving Average (EMA) and Simple Moving Average (SMA) can impact your results. Both have their pros and cons.
- Exponential Moving Average (EMA)
The EMA gives more weight to recent prices. It reacts quicker to price changes, which makes it ideal for fast-moving markets. Traders who focus on short-term opportunities may prefer the EMA. The quicker response time can help catch signals earlier, but it may also lead to more false signals.
- Simple Moving Average (SMA)
The SMA calculates the average of prices over a set period, giving equal weight to all prices. It tends to smooth out price fluctuations, which makes it more reliable in stable markets. Traders who prefer a more conservative approach may choose the SMA. It is less responsive than the EMA, but it can avoid some of the noise and false signals that can occur with faster-moving averages.
Which Should You Use? The decision depends on your trading style. Are you looking to act on quick price changes, or do you prefer a more reliable, stable signal? If you are a short-term trader, the EMA might suit you better. For long-term trends, the SMA could be a better choice. Either way, understanding how each moving average works will help you make more informed decisions.
Golden Cross And Death Cross in Different Markets
Golden Cross and Death Cross behave differently in each market. In the stock market, these signals are often reliable. If they appear, the market tends to follow through with significant price movements. Traders often see long-lasting bullish or bearish trends. You can see—in contrast, the Forex market can be trickier. Political events, interest rates, and global trade factors can affect price action. As a result, the signals don’t always lead to strong trends. However, combining them with other indicators can help.
The cryptocurrency market brings more volatility. A Golden Cross may cause a quick upward move, but it often faces sudden reversals. A Death Cross can signal a downturn, but crypto prices often recover quickly. In this market, traders must manage risk carefully. Commodity markets, on the other hand, are often more stable. Golden and Death Cross signals are more reliable here. Prices follow long-term trends based on supply and demand. A Golden Cross in oil or gold trading can start a strong rally. A Death Cross can indicate a steady downtrend.
Each market has its dynamics. These signals are useful across markets, but their effectiveness varies. You should understand the unique factors of each market is crucial. Are you ready to adjust your strategy based on the market you’re trading in?
Bottom Line
The Golden Cross and Death Cross offer valuable insights but should not be the only tools you rely on. You can see—these signals highlight potential trends, but they can sometimes lead you astray. Market conditions, breaking news, and unexpected events can affect price movements and give false readings. You should pair these signals with other indicators. No doubt—combining them with tools like the RSI, MACD, or volume analysis will improve their effectiveness. Risk management is crucial. Always set stop-loss orders and avoid trading based on one signal alone.


