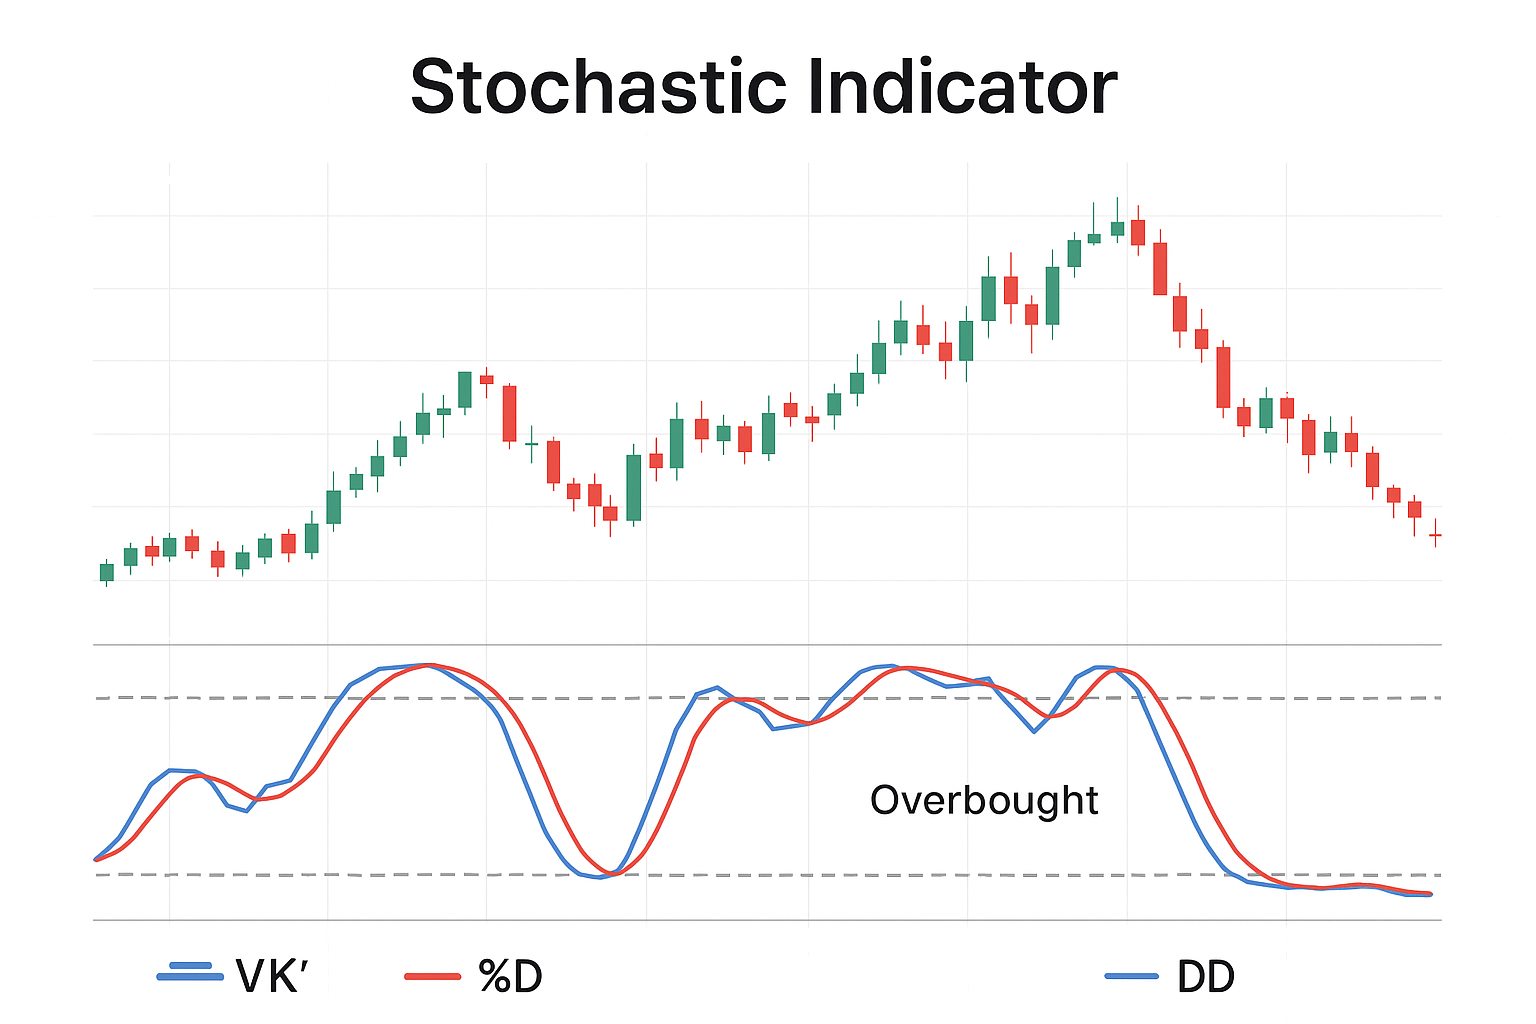
The Stochastic Oscillator is a momentum indicator that compares a currency pair’s closing price to its high-low price range over a specific period. Forex traders rely on this tool to identify overbought and oversold conditions, time entries and exits, and filter potential trading opportunities.
As a member of the momentum oscillator family of technical indicators, its primary role is to signal potential trend reversals or continuations before they are obvious on the price chart. This guide covers its components, settings, practical trading strategies, and how it compares to other popular indicators.
While understanding Stochastic Indicator is important, applying that knowledge is where the real growth happens. Create Your Free Forex Trading Account to practice with a free demo account and put your strategy to the test.
Key Takeaways
- The Stochastic Indicator is a momentum oscillator that compares the closing price to a recent high–low range.
- Overbought (>80) signals potential selling opportunities, while oversold (<20) signals potential buying opportunities.
- Default setting (14-3-3) works best for day trading; use 5-3-3 for scalping and 21-9-9 for swing trading.
- %K (fast line) and %D (signal line) crossovers provide buy/sell signals.
- Best strategies include overbought/oversold reversals, crossovers, divergences, and trend-pullback setups.
- Stochastic vs RSI → Stochastic performs better in ranging markets, while RSI is stronger in trending markets.
- Always confirm signals with trend filters, candlestick patterns, and risk management tools like stop-losses.
What is the Stochastic Indicator?
The Stochastic Indicator is a momentum oscillator that measures the position of a closing price relative to its recent high-low range. It helps traders identify overbought and oversold conditions, improving timing for entries and exits in forex and other financial markets.

It is plotted as two lines, %K and %D, that move between 0 and 100. The formula calculates where the most recent closing price is in relation to its recent high-low range. For example, if EUR/USD has a 14-day high of 1.2000, a low of 1.1800, and a current close of 1.1820, the %K value would be 10, signaling it is closing near the bottom of its recent range.
Components of the Stochastic Indicator
The indicator is composed of several key elements that work together to generate trading signals.
- The %K Line: This is the “fast” or main line, which plots the raw value of the Stochastic Oscillator.
- The %D Line: This is the “slow” or signal line. It is a moving average of the %K line, which smooths it out and is used to generate crossover signals.
- Overbought Zone: The area above the 80 level.
- Oversold Zone: The area below the 20 level.
- Divergence: When price and the Stochastic move in opposite directions, signaling a potential reversal.
Ready to Elevate Your Trading?
You have the information. Now, get the platform. Join thousands of successful traders who use Volity for its powerful tools, fast execution, and dedicated support.
Create Your Account in Under 3 MinutesBest Stochastic Settings for Forex Trading
The best Stochastic settings for Forex are (5,3,3) for scalping, (14,3,3) for day trading, and (21,9,9) for swing trading. Adjusting these settings is crucial for aligning the indicator’s sensitivity with your trading style and the market’s volatility.
| Trading Style | Recommended Setting | Purpose | Best For |
| Scalping | (5, 3, 3) | More sensitive to short-term price moves | Forex (1-min, 5-min charts) |
| Day Trading | (14, 3, 3) | Standard setting, balances sensitivity & smoothness | Forex, Stocks, Indices |
| Swing Trading | (21, 9, 9) | Smoother, reduces noise, focuses on longer-term momentum | Stocks, Commodities |
| Volatile Pairs | (21, 9, 9) or higher | Filters extreme volatility, more reliable signals | Crypto, Exotic Forex Pairs |
What is Stochastic 14-3-3?
The (14, 3, 3) setting is the most common default. The “14” represents the lookback period for the %K line, the first “3” is the smoothing factor applied to create the %D line, and the second “3” is the period for the %D line’s own moving average.
Is Stochastic Good for Scalping?
Yes, the Stochastic is a very popular indicator for scalping when its settings are adjusted to be more sensitive, such as (5, 3, 3). Scalpers use it on low timeframes (1-min, 5-min) to identify quick overbought and oversold conditions for rapid entries and exits.
How to Read the Stochastic Indicator
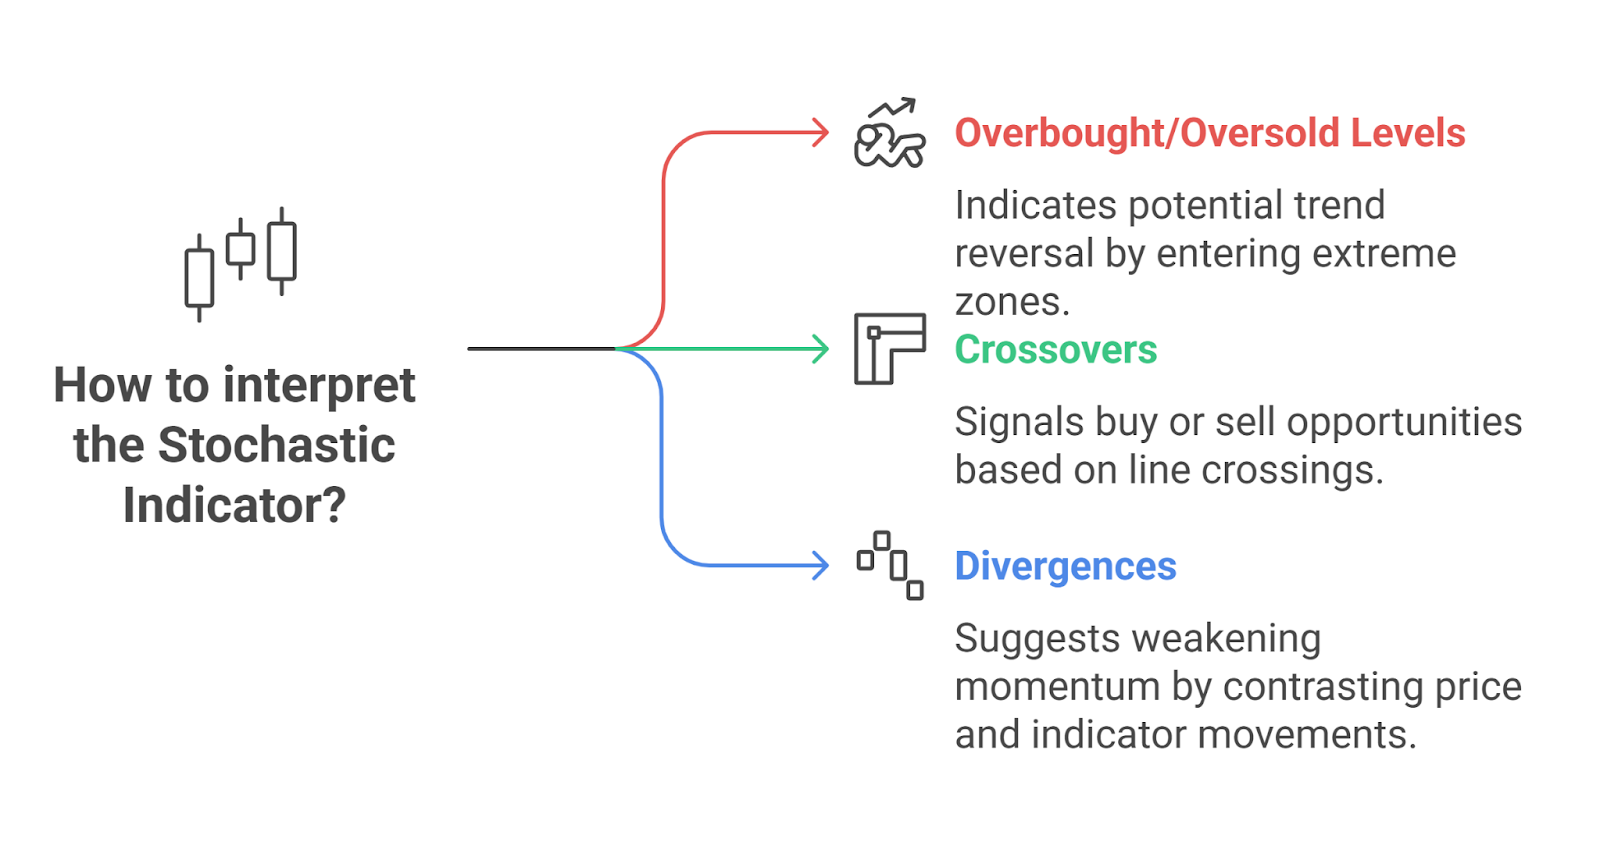
Reading the Stochastic involves watching for three primary signals.

- Overbought & Oversold Levels: The most basic signal is when the indicator enters the zones above 80 (overbought) or below 20 (oversold). This suggests the current trend may be losing momentum.
- Crossovers:
- Bullish Crossover: When the %K line crosses above the %D line in the oversold zone, it’s a potential buy signal.
- Bearish Crossover: When the %K line crosses below the %D line in the overbought zone, it’s a potential sell signal.
- Divergences:
- Bullish Divergence: Price makes a lower low, but the Stochastic makes a higher low. This signals weakening bearish momentum.
- Bearish Divergence: Price makes a higher high, but the Stochastic makes a lower high. This signals weakening bullish momentum.
Stochastic Indicator Strategies for Forex Trading
Overbought/Oversold Reversal Strategy
This strategy involves waiting for the indicator to signal a potential top or bottom.
- Sell Signal: Wait for the Stochastic to enter the overbought zone (>80) and then cross back below 80.
- Buy Signal: Wait for the Stochastic to enter the oversold zone (<20) and then cross back above 20.
When used with volatility tools, the signals gain extra weight. For example, combining the Stochastic with Bollinger Bands allows traders to confirm whether an overbought or oversold reading aligns with price touching outer bands, strengthening reversal or breakout setups. Traders also treat these setups as stochastic signals because they provide early momentum cues, which are then validated through other tools.
Crossover Strategy
This strategy uses crossovers for more precise entry signals.
- Buy Signal: Wait for a bullish crossover (%K crosses above %D) while the indicator is in the oversold zone.
- Sell Signal: Wait for a bearish crossover (%K crosses below %D) while the indicator is in the overbought zone.
Divergence Strategy
This is a powerful reversal strategy.
- Buy Signal: Identify bullish divergence and enter a long position after a confirming bullish candlestick pattern appears.
- Sell Signal: Identify bearish divergence and enter a short position after a confirming bearish candlestick pattern appears. Many traders specifically look for stochastic hidden divergence during trend pullbacks, since it confirms continuation rather than reversal.
Trend-Pullback Continuation Strategy
In a strong uptrend, ignore sell signals. Instead, use a bullish crossover in the oversold zone as a signal to buy on a pullback. In a downtrend, use a bearish crossover in the overbought zone as a signal to sell on a rally.
Stochastic Oscillator vs Other Indicators
Choosing the right oscillator often depends on the market condition (trending vs. ranging).
| Indicator | Measures | Best For | Key Weakness |
| Stochastic | Price momentum relative to its recent range | Ranging Markets | Prone to false signals in strong trends. |
| RSI | Speed and change of price movements | Trending Markets | Can stay overbought/oversold for long periods. |
| MACD | Relationship between two moving averages | Trending Markets | Lagging indicator; not ideal for ranges. |
Is Stochastic Better Than RSI?
Neither is universally “better,” but the Stochastic is often preferred for ranging markets, while the RSI Indicator is preferred for trending markets.
The RSI, like the Stochastic, is a momentum indicator used in technical analysis, but it measures the magnitude of recent price changes to evaluate overbought or oversold conditions. Because the Stochastic is based on price’s position within a high-low range, it tends to oscillate more reliably between 0 and 100 in sideways markets, providing clearer reversal signals.
Advantages and Limitations
Advantages
- Provides clear and easy-to-read overbought and oversold signals.
- Versatile tool that can be used for reversal, trend-following, and divergence strategies.
- Works well across different markets and timeframes.
Limitations
- Prone to generating false signals in strongly trending markets.
- Can be “choppy” and produce too many signals on lower timeframes.
- It is a lagging indicator, as it is based on past price data.
Common Mistakes to Avoid
- Blindly Selling at 80 / Buying at 20: In a strong trend, the indicator can stay overbought or oversold for long periods.
- Ignoring the Overall Trend: A Stochastic buy signal is much less reliable in a strong downtrend.
- Using the Wrong Settings: Using scalping settings (5,3,3) for swing trading will result in too much market noise and false signals.
Does Stochastic Work in Strong Trends?
The Stochastic is less reliable in strong trends when used as a reversal tool. In a powerful uptrend, the indicator can stay in the overbought zone for a long time, giving repeated, false sell signals. In these conditions, it is better used to identify pullbacks (dips to the oversold zone) as potential entry points in the direction of the trend.
Tips for Using Stochastic Effectively in Forex
- Use a Trend Filter: Always use the Stochastic with a trend-following tool like a moving average or ADX. Only take buy signals when the price is above its 200-period MA, and vice versa.
- Confirm with Candlestick Patterns: A Stochastic signal is much stronger when confirmed by a reversal candlestick pattern (e.g., a hammer or shooting star).
- Adjust Settings for the Market: Don’t be afraid to test and optimize settings for different currency pairs and timeframes on a demo account.
- Always Use a Stop-Loss: No indicator is perfect. Always define your risk with a stop-loss on every trade.
Turn Knowledge into Profit
You've done the reading, now it's time to act. The best way to learn is by doing. Open a free, no-risk demo account and practice your strategy with virtual funds today.
Open a Free Demo AccountConclusion
The Stochastic Indicator is a powerful and versatile tool in a forex trader’s arsenal. Its strength lies in its ability to provide early signals of potential momentum shifts and highlight overbought or oversold conditions.
However, it is not a standalone system. For the best results, combine the Stochastic with other confirmation indicators, price action analysis, and a disciplined approach to risk management. The most effective way to master this indicator is to practice using it on a demo account until you can confidently interpret its signals.


